If your solution to stated problem does not match the given solution, you should self-critique per instructions at
http://vhcc2.vhcc.edu/dsmith/geninfo/labrynth_created_fall_05/levl1_22/levl2_81/file3_259.htm
.
Your solution, attempt at solution. If you are unable to attempt a solution, give a phrase-by-phrase interpretation of the problem along with a statement of what you do or do not understand about it. This response should be given, based on the work you did in completing the assignment, before you look at the given solution.
At the end of this document, after the qa problems (which provide you with questions and solutions), there is a series of Questions, Problems and Exercises.
Question: `q001. Evaluate the double integral Int[ Int((x + y) dy, 1, 2) dx, -1, 1].
What is shape of the 2-dimensional region over which this integral is taken?
What function is integrated over this region?
Your solution:
Confidence rating:
Given Solution:
This notation can be read as follows:
Do the integral with respect to x, from x = -1 to 1, of the integral of (x + y) with respect to y, from y = 1 to y = 2.
In standard symbols the integral is written
To evaluate the integral we first do the 'inner' integral int( (x + y) dy, -1, 2), i.e., the integral of x + y, with respect to y, from y = -1 to y = 2.
Our antiderivative of (x + y) will be x y + y^2 / 2. You should check to verify that the partial derivative of this expression with respect to y is (x + y).
The change in this expression between y = -1 and y = 2 is
(x * 2 + 2^2 / 2) - (x * (-1) + (-1)^2 / 2) ) = 2x + 2 - (-x + 1/2) = 3x + 3/2.
So our original integral becomes
int( (3x + 3/2) dx, -1, 1),
i.e. the integral of 3x + 3/2 from x = -1 to x = 1.
You can easily verify that this integral has value 3.
The region of integration is described by
-1 <= x <= 1
1 <= y <= 2.
You should easily be able to verify that this region consists of all points (x, y) within the rectangle described by the two inequalities.
The function being integrated is the function that returns x + y for the ordered pair (x, y). In function notation this function can be written as
f(x, y) = (x + y).
DER
Self-critique (if necessary):
Self-critique rating:
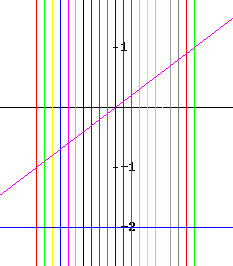
Question: `q002. Evaluate the double integral Int[ Int((x + y) dy, -1, x) dx, -2, 1].
What is the shape of the 2-dimensional region over which this integral is taken?
Your solution:
Confidence rating:
Given Solution:
This notation can be read as follows:
Do the integral with respect to x, from x = -1 to 1, of the integral of (x + y) with respect to y, from y = -2 to y = x.
In standard symbols the integral is written
To evaluate the integral we first do the 'inner' integral int( (x + y) dy, -2, x), i.e., the integral of x + y, with respect to y, from y = -2 to y = x.
Our antiderivative of (x + y) will be x y + y^2 / 2. You should check to verify that the partial derivative of this expression with respect to y is (x + y).
The change in this expression between y = -2 and y = x is
(x * x + x^2 / 2) - (x * (-2) + (-2)^2 / 2) ) = 3/2 x^2 - (-2 x + 2) = 3/2 x^2 + 2x - 2.
So our original integral becomes
int( (3/2 x^2 + 2x - 2) dx, -1, 1),
i.e. the integral of 3/2 x^2 + 2x - 2 from x = -1 to x = 1.
You can easily verify that this integral has value -3.
The region of integration for this problem is described by
-1 <= x <= 1
-2 <= y <= x.
The region -1 <= x <= 1 is just the vertical region lying between the two colored vertical lines in the figure below:
The restriction -2 <= y bounds the region below by the line y = -2.
The restriction y <= x bounds the region above by the line y = x.
The four lines bounding the region are depicted in the figure below:
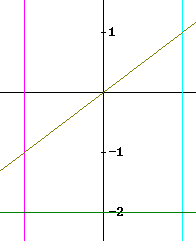
For each value of x between -1 and 1, the value of y within the region goes from -2 to x.
The region can be geometrically described as trapezoid.
DER
Self-critique (if necessary):
Self-critique rating:
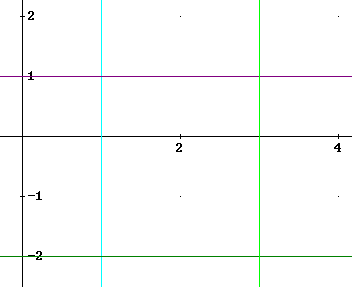
Question: `q003. Integrate the function f(x, y) = (x y + y^2) over the region bounded by the colored lines in the figure below:
Your solution:
Confidence rating:
Given Solution:
The depicted region includes all points between the lines x = 1 and x = 3, for which y lies between -2 and 1. The region can thus be described by
1 <= x <= 3
-2 <= y <= 1.
For any value of x between 1 and 3, the region includes the line segment from y = -2 to y = 1. The set of all such line segments constitutes a rectangle with dimensions 2 by 3.
An integral corresponding to this description is
int( int( (xy + y^2) dy, -2, 1) dx, 1, 3).
That is, it is the integral with respect to x from x = 1 to x = 3, of the integral of (xy + y^2) along the line segment form y = -2 to y = 1, i.e., of the integral with respect to y from y = -2 to y = 1.
In standard notation the integral looks like this:
To perform the integral we first do the 'inner' integral, integrating xy + y^2 with respect to y from y = -2 to y = 1. Our antiderivative will be x y^2 + y^3 / 3. You should verify that the partial derivative of this expression with respect to y is the original integrand.
The values of this antiderivative at y = -2 and y = 1 are 4x - 8 and x + 1. The change in the value of the antiderivative over this interval is thus -3x + 9, and this is the value of our y derivative.
Integrating this with respect to x from x = 1 to x = 3 (something you should do for yourself before reading the rest of this sentence) we get antiderivative -3/2 x^2 + 9 x, which between x = -1 and x = 3 changes from 15/2 to 27/2, a change of 6.
Our final result is therefore six.
Self-critique (if necessary):
Self-critique rating:
Question: `q004. This problem differs from most in that answers to the first several questions are provided within the problem, in italics. You are encouraged to answer the questions before reading the solutions, but if you really understand what has been done to this point you might not need to do so. There are unanswered questions after the last italicized answers, and these questions should be answered as your solution.
The graph below depicts a region used in an earlier problem. For reference we will call this region R.
(Note on notation: x_i means x with a subscript i. x_i is a standard subscripted variable referring to the i_th term in a sequence of x values. The i_th subinterval of a partition typically runs from x_(i-1) to x_i. The sample point in a subinterval is often notated by putting the symbol ^ over the top of the variable. We call this symbol a 'hat'. Thus x_i_hat would be written on paper as x with a hat over it, and a subscript i).
Suppose we have partitioned the x axis of the graph below into subintervals of width `dx, each subinterval containing some designated but unspecified sample point x_i_hat. For each such subinterval there is a vertical 'strip' of the region R whose x coordinates lie within our subinterval. Recall that the x values of the two vertical colored lines are -1 and 1. Recall also that the region can be described by the inequalities
-1 <= x <= 1
-2 <= y <= x.
The figure below depicts our region and a series of vertical 'strips' corresponding to a partition of the interval into 20 subintervals.
For one of the depicted subintervals, suppose that our sample point is x_i_hat = -.25.
Which of the 20 intervals could this be?
What are the maximum and minimum y values within our region R, within the corresponding 'strip'?
The x interval has length 2, so dividing it into 20 equal subintervals requires interval width 0.1. x_i_hat = -.25 lies within the interval between x = -0.3 and x = -0.2. This is the 8th subinterval of the partition.
For any x, we have -2 <= y <= x. So the lower limit of y values on any vertical line is -2. The upper limit for any y value is x. The highest point within the interval is along the right-hand edge of the strip, on the line x = -0.2, so the greatest possible value of x on this interval is -0.2. (There is a technicality here, but don't let this be a distraction. The technicality is that a partition breaks an interval into separate regions with no intersection, so the line x = -0.2 cannot lie in both the 8th and 9th 'strips'. Including that line in the 8th interval is therefore questionable, but at the very worst we can say that all x values up to, but not including, -0.2 are possible.)
You should locate x = -0.2 on the graph above and convince yourself that the highest point with x coordinate -0.2 that lies within the region is the point (-0.2, -0.2).
If for some other subinterval we have sample point x_i_hat = .25, then what are the minimum and maximum possible values of y within the region, for points having this x coordinate?
For any x, the region is bounded above and below by the lines y = -2 and y = x. So we have -2 <= y <= x. The lower limit of y values on any vertical line is -2. The upper limit for any y value depends on x, and is in this case equal to the value of x. The values of y on the vertical line x = x_i_hat = .25 therefore range from -2 to .25.
You should locate x = .25 on the graph above and convince yourself that the highest point with x coordinate .25 that lies within the region is the point (0.25, 0.25), and that the lowest point with this x coordinate is (.25, -2).
If we wish to subdivide this y interval into 10 equal subintervals, what would have to be the length `dy of each interval? What if we wanted to subdivide it into 100 equal subintervals?
The y interval corresponding to x_i_hat = .25 was just found to be the interval -2 <= y <= .25. This interval has length .25 - (-2) = .25 + 2 = 2.25. Subdivided into 10 equal subintervals the length of each would be .225.
If for some other subinterval of the x axis we have an unspecified sample point x_i_hat, then in terms of just the symbol x_i_hat what are the minimum and maximum possible values of y within the given region, for points having this x coordinate? If we wanted to subdivide this y interval into n equal subintervals, what would be the length of each?
The minimum y value within the region, for any vertical line, is -2 and the maximum is x, where x is the common horizontal coordinate of all points on the line. So if x = x_i_hat, the y interval is -2 <= y <= x_i_hat.
This interval has length x_i_hat - (-2) = x_i_hat + 2. Subdividing it into n equal subintervals results in subintervals each with length (x_i_hat + 2) / n.
You are asked to give the answers to the remaining questions as your solution:
Suppose we subdivide the region R by using the previous subdivision of the x interval into 20 subintervals, and each y 'strip' within the region R into subintervals of length 0.05. This divides the region (most of it, at least) into small rectangles each with dimension 0.1 by 0.05. (Note that this can run into a little difficulty at the top of each trapezoidal strip, where the last such two rectangles aren't complete rectangles. This becomes irrelevant as the number of subintervals approaches infinity, so it can be dealt with, but for now let's just agree to ignore it.) Let's also agree to use the point right in the center of each region for its sample point x_i_hat (as the sizes of the rectangles is diminished all points get closer and closer to the sample point, so ultimately we don't have to specify exactly which point we use for the sample point, but for now it's convenient to just use the center of the rectangle).
Now suppose that above the region R we have the plane z = 2x + y + 10.
How high is the plane above each corner of the region R?
What do you think would be a reasonable estimate of the volume of the region above R and below the plane?
One of the small rectangles into which the region R has been subdivided is described by .4 <= x <= .5, .1 <= y <= .15. Verify that these inequalities describe a rectangle within the region R. Then find the coordinates of the sample point within this region, and find the height of the plane above this point, as well as the volume of the region of the same height lying above this small rectangle.
The strip corresponding to the x interval .4 <= x <= .5 contains a number of rectangles of this sort. The sample points of all these rectangles have a common x coordinate. What is their common x coordinate?
The height of the plane is z = 2 x + y + 10. For the strip .4 <= x <= .5 the x coordinate of every sample point is the same, so it may be substituted for x. The small rectangles within this strip have various y coordinates. So, for rectangles in this strip, what is the expression for the height z of the rectangle (y, being different for different rectangles, will still be a variable but x will have a fixed value)?
Your solution:
Confidence rating:
Given Solution:
The upper right-hand corner of the region is at (1, 1). At this point the height is z = 2 * 1 + 1 + 10 = 13. The heights of the other corners are found in a similar manner.
The heights of all the corners are in the very rough neighborhood of 10. The area of the region R is 4. So the volume is that of a prism with cross-sectional area 4 and average height about 10, giving the region a volume of about 40. This is unlikely to be the actual volume, but it is a reasonable approximation, and any result obtained for the volume should not differ greatly from 40.
The portion of the plane lying above x = .45 has a height that varies with y. The height along the line x = .45, as a function of y, is z = 10.9 + y.
Self-critique (if necessary):
Self-critique rating:
Question: `q005. The triangle with vertices (2, 3), (2, 6) and (8, 6) lies directly above the x interval 2 <= x <= 8 and directly across from the y interval 2 <= y <= 6. However the inequalities 2 <= x <= 8 and 3 <= y <= 6 do not describe the region.
Why not?
How could the region be described using inequalities?
How would we set up the integral of f(x, y) over this region?
Your solution:
Confidence rating:
Given Solution:
The inequalities 2 <= x <= 8 and 3 <= y <= 6 can be read as "for every value of x between 3 and 8, the region includes the line segment running from y = 3 to y = 6, or more correctly, running from the point (x, 3) to the point (x, 6)".
All the lines from (x, 3) to (x, 6), for 2 <= x <= 8, form a rectangle with corners at (2, 3), (2, 6), (8, 6) and (8, 3).
This rectangle is not a triangle, so these inequalities do not describe a triangular region.
The triangular region is bounded above by the line y = 6, and below by the line segment joining the points (2, 3) and (8, 6).
It would be correct to say that, for a given x, the region includes the vertical line segment above (x, 0), starting at the line segment joining the points (2, 3) and (8, 6) and ending at y = 6. That line segment is part of the straight line y = 1/2 x + 2, which is easily obtained using standard precalculus reasoning, so the line segment within the region, corresponding to x, goes from the point (x, 1/2 x + 2) to the point (x, 6).
The region is therefore described by the inequalities
2 <= x <= 8, 1/2 x + 2 <= y <= 8.
The integral of f(x, y) over this region could be written as
integral ( integral( f(x, y) dy, y from 1/2 x + 2 to y = 6) dx, x from 2 to 8).
The figure below depicts the lines y = 6, x = 2, x = 8 and y = 1/2 x + 2 bounding the triangular region.
In addition a number of vertical lines, corresponding to x values 3, 3.2, 3.4, 3.6, ..., 8, are also included. The portion of each vertical line which passes through the region between y = 1/2 x + 2 and y = 6. You should pick a couple of these lines and verify that it is so.
There is another alternative to this description. All points of the region have y coordinates between 3 and 6, and for a typical value of y between 3 and 6 the corresponding horizontal line segment is part of the triangle from the vertical line x = 2 to the line y = 1/2 x + 2. The x coordinate at which the horizontal line meets the line y = 1/2 x + 2 is found by simply solving the equation for x. Solving, we obtain x = 2 y - 4.
Thus the horizontal line corresponding to y runs from x = 2 to x = 2 y - 4. You should pick a couple such lines in the figure below and verify this.
It follows that the region could be described as 3 <= y <= 6, 2 <= x <= 2y - 4.
The integral corresponding to this description would be
integral( integral( f(x, y) dx, x from 2 to 2y - 4) dy, y from 3 to 6).
Self-critique (if necessary):
Self-critique rating:
Question:
`q006. Verify that, for the function f(x, y) = 1, the two integrals found in the preceding solution have the same value. Those integrals were
integral ( integral( f(x, y) dy, y from 1/2 x + 2 to y = 6) dx, x from 2 to 8)
and
integral( integral( f(x, y) dx, x from 2 to 2y - 4) dy, y from 3 to 6).
Show also that both integrals are equal to the area of the triangle.
Your solution:
Confidence rating:
Given Solution: The integraion in both cases is straightforward and the result of both integrals will be 9. The area of the triangle is also 9. You should give the details of the associated reasoning.
For the first integral it was y that was integrated first, yielding an expression whose only variable was x. The x integral of this result was then found, with integration limits 2 and 8.
For the first integral it was y that was integrated first, yielding an expression whose only variable was y. The y integral of this result was then found, with integration limits 3 and 6.
Between the first integral and the second, we say that the order of integration was reversed.
Self-critique (if necessary):
Self-critique rating:
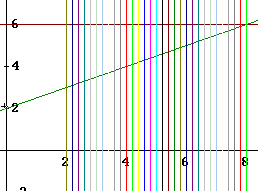
Question: `q007. Identify the region of integration corresponding to the integral
int( int( 1 * dy, y from 1 to 4 + 3/2 x) dx, x from 2 to 6).
Find the area of this region and compare to the result of the integration.
Reverse the order of integration and verify that the result is again the same.
Your solution:
Confidence rating:
Given Solution:
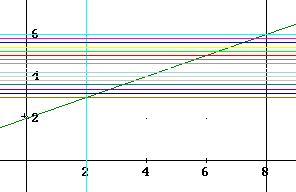
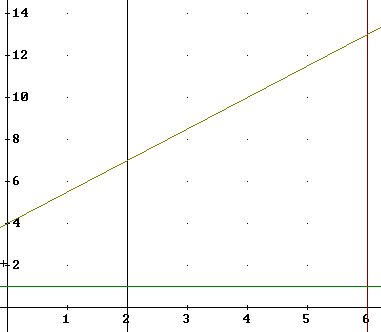
The region is bounded by the lines y = 1, y = 4 + 3/2 x, x = 2 and x = 6.
The points where these lines intersect can be found by solving the equations of the four lines in pairs. For example the equations y = 1 and x = 6 intersect in the obvious point (1, 6). The intersection of the equations y = 4 + 3/2 x and x = 2 is easily found by substituting x = 2 into the equation y = 4 + 3/2 x, obtaining y = 7 and the point (2, 7). You should show the details of finding the other two points.
The four points are (2, 1), (6, 1), (2, 7) and (6, 13).
It should be clear that the region is a trapezoid, with two parallel sides.
The graphs of the defining equations are shown below, and confirm the algebraic solutions that yielded the coordinates.
The integration is straightforward. You should have written the integral in standard notation as
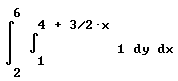
and obtained the value 36.
The trapezoid can easily be reconstructed into a rectangle whose 'vertical' dimension is the mean (6 + 11) / 2 = 9 of its vertical sides and whose horizontal dimension is 6-2 = 4 so that its area is 9 * 4 = 36, in agreement with the value obtained for the integral.
To describe the region in terms of horizontal line segments we run into a small difficulty. For 1 <= y <= 7 the region is bounded by the vertical lines x = 2 and x = 6. However for 7 <= y <= 13 the boundary is the sloping line y = 4 + 3/2 x.
The lower part of the region is easily described by the inequalities 1 <= y <= 7, 2 <= x <= 6. You can easily verify that the part of the region characterized by 1 <= y <= 7 is rectangular, and that this is consistent with the inequalities.
For a given value of y in the upper part, the x coordinate at which a horizontal line encounters the line y = 4 + 3/2 x is easily enough found by solving the equation for x. We get x = 2/3 y - 8/3. The line enters the region at this x coordinate and exits it at coordinate x = 6.
So a horizontal line corresponding to coordinate y will intersect the region between x coordinates 2/3 y - 8/3 and 6, and we have our description of the upper part of the region:
7 <= y <= 13, 2/3 y - 8/3 <= x <= 6.
The integral for the upper part of our region is therefore
integral(integral( 1 dx, x from 2/3 y - 8/3 to x = 6) dy, y from 7 to 13).
It should be clear that the integral for the lower part of our region is
integral(integral(1 dx, x from 2 to 6) dy, y from 1 to 7).
Integration is again very straightforward. The second integral has value 24, corresponding to the area of the 4 by 6 rectangle comprising the lower part of the region. The first integral, corresponding to the area of the upper part of the region, is 12 and corresponds to the area of the triangle comprising the upper part. The sum of the two integrals is 36, in agreement with our previous integral and our previous determination of the area of the trapezoid.
You are encouraged to pick a couple of horizontal lines in the figure below, one corresponding to a y value between 1 and 7 and another to a y value between 7 and 13, and verify that the first intersects the trapezoid at x = 2 and x = 6, while the second intersects it at x = 2/3 y - 8/3 and x = 6.

Self-critique (if necessary):
Self-critique rating:
Question:
`q008. Describe the region bounded by the curves y = x^2 and y = 1 - 2 x^2.
Integrate the function f(x,y) = 1 + x^2 + y^2 over this region.
The first curve is just a parabola with vertex through the origin, passing through (1, 1) and (-1, 1) as it opens upward. Using standard shifting and stretching arguments from precalculus, we reason that -2 x^2 is the same graph but turned upside down, then stretched vertically by factor 2 before being shifted +1 unit vertically, so that its vertex is raised to (1, 0) and it opens downward, passing through the points (1, -1) and (-1, -1).
This description makes it clear that the two curves intersect at two points, both lying somewhere between x = -1 and x = 1.
To find the points of intersection we set the two expressions equal, obtaining the equation
x^2 = 1 - 2 x^2.
The equation is easily rearranged to 3 x^2 = 1, so that x = +-sqrt(1/3) = +-sqrt(3) / 3.
The region can thus be described as follows:
-sqrt(3)/3 <= x <= sqrt(3)/3
x^2 <= y <= 1 - 2 x^2,
where we are careful to note that the graph of 1 - 2 x^2 lies above and the graph of x^2 below our region on the relevant interval.
Our integral will therefore be
integral(integral((1+x^2+y^2) dy, y from x^2 to 1 - 2 x^2) dx, x from -sqrt(3)/3 to sqrt(3)/3)
The integration is straightforward, if done carefully and methodically, with the resulting value 188 sqrt(3) / 315 (which is approximately 1.03).
Your solution:
Confidence rating:
Given Solution:
Self-critique (if necessary):
Self-critique rating:
Question:
`q009. Describe the region between the graphs of x^2 + y^2 = 1 and y = x^2, and set up the integral required to integrate the function f(x, y) = 1 / (x^2 + y^2 + 1) over this region. You may go ahead and do the integral if you wish, but this is not required.
Your solution:
Confidence rating:
Given Solution: No solution is given for this problem. However you do want to start out by sketching those two curves and finding their points of intersection. The region looks a lot like the region from the preceding problem, but as you will see the points of intersection and other expressions do differ.
Self-critique (if necessary):
Self-critique rating:
Question:
`q010. Describe the region bounded by the x axis, the y axis and the curve y = 1 - 2 x^2 in terms of cross-sections parallel to the x axis, and then in terms of cross-sections parallel to the y axis.
Your solution:
Confidence rating:
Given Solution: You will want to start by finding the inequality that describes the y values encountered by a vertical line with coordinate x. Then you will want to find the inequality that describes the x values encountered by a horizontal line with coordinate y.
Self-critique (if necessary):
Self-critique rating: