On a certain island live an immortal race of 1000 non-reproducing people. Using a standard psychiatric evaluation developed and refined over a great number of years, every individual can be clearly classified as either sane or demented. Due to various physical, social and psychological factors, in a period of one year every sane individual has a 10% chance of becoming demented, and every demented individual has a 20% chance of becoming sane.
......!!!!!!!!...................................
RESPONSE -->
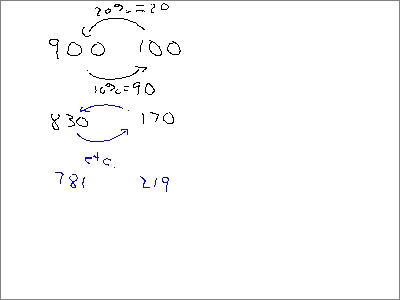
In the year 2001, there will be 830 sane people and 170 demented people.
In the year 2002, there will be 781 sane people and 219 demented people.
I found this by taking 10 percent of 900 and adding it to 100 - 20%, and taking
that 20 percent of 100 and adding it to 900 - 10%.
I then repeated the process for 781 and 219.
.................................................
......!!!!!!!!...................................
If you do a three-step random walk then at what displacements can you possibly end up relative to your starting point? Explain exactly what has to happen, coin flip by coin flip, to attain each of these displacements.
......!!!!!!!!...................................
RESPONSE -->
UP, DOWN, UP WILL BE ONE SPACE ABOVE STARTING POINT represented BY HEADS, TAILS,
AND HEADS.
DOWN, up, down one space below starting point represented by tails, heads, and
tails.
Up, up, down will be one step above the starting point reperesented by heads,
heads, and tails.
Down, down, up will be one step below starting point represented by tails,
tails, and heads.
Up, up, up will be three steps above starting point represented by heads, heads,
and heads.
Down, down, down 3 steps down represented by tails, tails, and tails.
****
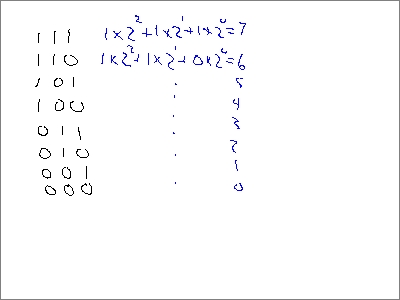
3, 1, -1, -3;
** Note how we can do a binary coding of the possibilities, using 1 for Heads and 0 for Tails. For example
011 means
THH
and is the code for the decimal number 0 * 2^2 + 1 * 2^1 + 1 * 2^0 = 0 + 2 + 1 = 3.
.................................................
......!!!!!!!!...................................
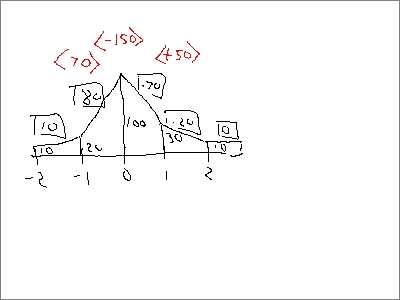
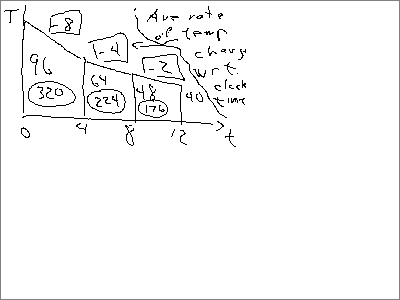
Suppose we have a long row of trees with 100 bugs on the center tree, 30 bugs on
the tree immediately to the right and 20 bugs on the tree immediately to the
left, and 10 on each of the other trees. The center tree is number 0, the trees
to the right are numbered 1, 2, 3, … and the trees to the left are numbered –1,
-2, -3, … . During each hour 10% of the bugs that were on a given tree at the
beginning of the hour migrate to each of the tree’s neighbors. How many bugs
will there be on each tree after each of the first two hours? Sketch a graph of
the number of bugs on trees number -2, -1, 0, 1 and 2, with number of bugs on
the vertical axis and the number of the tree on the horizontal axis. Label the
graph as a trapezoidal approximation graph and label the slopes. For the graph
point corresponding to each tree find the change in the slope (i.e., write down
the slope to the left and the slope to the right, and find the change from one
slope to the next?
** Challenge question: How could we calculate the population after a transition from the population before transition by multiplying matrices? **
RESPONSE -->
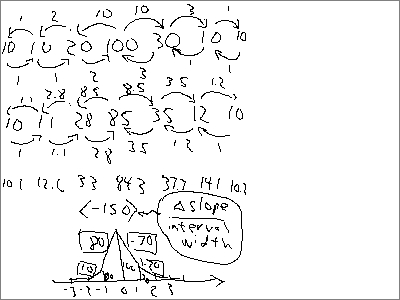
ONE SOLUTION:
BEGIN 10 20 30 30 10
HOUR1 10 20 29 28 11
HOUR2 10 19.9 28 26.4 11.6
Interval Change in Slope
1 - 2 8.1 - 9.9 = -1.8
2 - 3 1.6 - 8.1 = -9.7
3 - 4 -14.8 + 1.6 = -13.2
........................................
ANOTHER SOLUTION:
start with 10, 10, 20, 100, 30, 10, 10, ...
hour 1: ...10, 11, 27, 85, 35, 12, 10...
** Note that the first tree loses 15 bugs and its rate of slope change is -150. Note that the transition rate is 10%, interval length is 1 and that -15 is 10% of -150 divided by 1 (also -15 is 10% of -150 multiplied by 1). Should we multiply by interval width or divide?
Rate of slope change is change in slope / interval width. **
hour 2: ...10, 10.1, 12.5, 31.2, 74, 37.7, 14.1, 10.2, 10...
Slopes: 18.7, 42.8, -36.3, -23.6
Change of Slope: +24.1, -79.1, +12.7
.................................................
......!!!!!!!!...................................
10:16:27
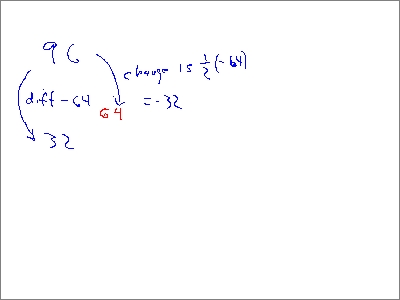
Suppose that the temperature of a certain object in a room gets twice as close
to the room temperature every 4 minutes. If the object starts at a temperature
of 96 degrees, while room temperature is 32 degrees, then what will the
temperatures be after each of the first three 4-minute time intervals? Write
your temperatures as a sequence of numbers and given a rule for calculating the
next member of the sequence from the present number. Sketch a trapezoidal graph
of temperature vs. clock time and label both slopes and areas.
What does the area of a trapezoid represent? Start by asking yourself what the average height of the trapezoid represents, then what the width represents, then what the product of these two quantities represents.
Note that average height does not represent change in temperature. What does represent change in temperature?
......!!!!!!!!...................................
RESPONSE -->
64, 48, 40 (sequence of temps)
Rule: curent temp .5(current temp - room temp)
.................................................
......!!!!!!!!...................................
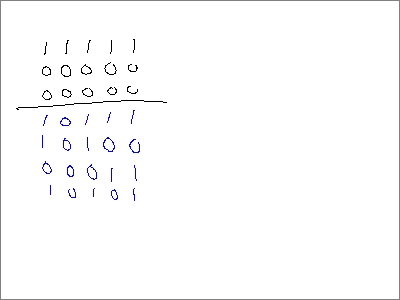
There are 5 Christmas trees in a circle. Every two seconds, each tree looks at
each of its nearest neighbors to see whether their lights are on or off.
If exactly one of its neighbors has its lights on, it turns its light switch to the 'on' position. Otherwise it turns its light switch to the 'off' position.
......!!!!!!!!...................................
RESPONSE -->
If all the trees except one have their lights on
(trees)
1 2 3 4 5
on on off on on
(2sec) off on off on off
(4sec) on off off off on
(6sec) on on off on on
(8sec) off on off on off
(10sec)on off off off on
If only 2 adjacent trees have their lights on
(trees)
1 2 3 4 5
start on on off off off
(2sec)on on on off on
(4sec)off off on off on
(6sec) on on on off on
(8sec) off off on off on
(10sec)on on on off on
.................................................
Sketch a trapezoidal graph of y = x^2 + 10 for x = 0, 2, 4 and 6. Label the
slopes. Write the slopes as a sequence. Find the first-difference sequence and
the second-difference sequence. What do you notice?
What is the pattern of the average rates of change of y = x^2 + 10 with respect to x?
......!!!!!!!!...................................
RESPONSE -->
For x = 0, 2, 4, 6 the function y = x^2 + 10 gives us values 10, 14, 26, 46.
The sequence 10, 14, 26, 46 has first difference
4, 12, 20. The second difference is
8, 8.
Ave. rates of change are obtained by dividing change in y by change in x.
Our table is
x y
0 10
2 14
4 26
6 46
so ave rates of change are respectively
first interval: (14-10) / (2-0) = 4/2 = 2
second interval: ( 26 - 14) / (4 - 2) = 12 / 2 = 6
third interval: (46 - 26) / (6 - 4) = 20 2 = 10.
Ave rates are 2, 6, 10.
Ave rates seem to be changing by the same amount with each interval.
For a quadratic function the average rate at which rate changes is constant. If the average rate at which rate changes is constant then our function is quadratic.
The slope increases by 4 every time.
For every x + 1, you get y + 2
.................................................
......!!!!!!!!...................................
Make a sequence of the ratios of the sequence 1, 2, 3, 5, 8, 13, 21, 34, 55, 89.
The first member of the sequence is 2/1 = 2, the second is 3/2 = 1.5, the third
is 5/3=1.666.., etc.. Find the first and second differences of this new sequence
of ratios. What do the first and second differences tell you about the graph of
the sequence of ratios?
......!!!!!!!!...................................
RESPONSE -->
2 1.2 1.666 1.6 1.625 1.615 1.619 1.618 1.618
-.8 .466 -.066 .025 -.01 .004 -.001 0.000
1.266 -.532 .091 -.035 .014 -.005 .001
The first difference tells me that the model of the graph will go up and down
instead of steady one way or the other. The second says that the slope will
increase and decrease at uneven intervals.
.................................................
......!!!!!!!!...................................
11:03:15
Sketch a trapezoidal graph of y = 4 + 1.2 ^ x for x = 0, 2, 4 and 6. Label the
slopes. Write the slopes as a sequence. Find the first-difference sequence and
the second-difference sequence. What do you notice? What is the pattern of the
average rates of change of y = 4 + 1.2 ^ x with respect to x? What is the
average y value for each interval? For each interval divide the average rate of
change for that interval by the average value of the function and write your
results as a sequence.
......!!!!!!!!...................................
y = 0^2 + 10=10
y = 2^2 + 10=14
y = 4^2 + 10=26
y = 6^2 + 10=46
10 14 26 46
4 12 20
8 8
.................................................
.................................................
......!!!!!!!!...................................
10:34:05
When a pendulum is at displacement x from its equilibrium position, the rate at
which its velocity changes with respect to clock time is given by
which is abbreviated
If the pendulum is originally 10 cm from its equilibrium position and at rest then:
· At what rate is the velocity changing with respect to clock time?
** the rate is -200 cm/s/s **
· If the velocity continues changing at this rate then what will be the velocity after .1 second?
** the velocity will be -.1 s * -200 cm/s **
· What then will be the average velocity for this .1 second time interval?
** velocity goes from rest (0 cm/s) to -20 cm/s so ave velocity is -10 cm/s. **
· How much will the position of the pendulum therefore change during the .1 second interval?
** velocity is rate of change of position wrt clock time. So change in position is ave rate of change of position wrt clock time * change in clock time = -10 cm/s * .1 s = -1 cm. **
· What will be the new displacement of the pendulum?
** the position started at 10 cm and changed by -1 cm so the new position is 9 cm. **
Find the new rate of change of velocity, the change
in velocity for the next .1 second interval, the average velocity over that
interval, the change in position during this .1 s interval and the new position.
......!!!!!!!!...................................
ONE ATTEMPT
(-20/10) -2 cm/sec
(-30/10) -3 cm/sec if it continues
(10/10)= 1 average rate of velocity change
10 cm/sec of change
-40 cm (-30-10)
ANOTHER SOLUTION
I am not quite sure about this answer but, would the avg. rate veloc. is
changing be -200cm/sec/sec.
** Yup. x is displacement from equilibrium, which is 10 cm and the rate of change of velocity with respect to clock time is dv/dt = -20 cm/s/s * x = -20 cm/s/s * 10 =-200 cm/s/s. **
If this rate continues for .1sec, then the speed would be -20 cm/sec.
The avg. vel. for this interval is -1cm/sec.
This means that the position will change by -2 cm during this interval. So the
new displacement would be 8cm.
I think I did this entire problem incorrectly, but I am not sure what I did
wrong or where I went wrong.
get a half_meter stick, a rubber band and a paperclip. have a paper ruler with your group.
project the half-meter stick across the floor using different rubber band lengths and measure how far it goes with each length
make sure everyone has the data
Analysis:
Sketch a trapezoidal approximation graph of rubber band force vs. rubber band stretch, assuming that the force exerted by the rubber band is .85 newtons * stretch in cm.
interpret slopes and areas of your trapezoids
for each length find the sum of all the graph areas up to that length and insert it into the trapezoid, in parentheses
graph distance of sliding half-meter stick vs. the total area up to the corresponding stretch (the number in parentheses on your graph)
other assignments:
review today' s notes
self_critique your test
more questions on test or on homework problems
more work on weekend assignment