#Quiz 1 #Quiz 2 #Quiz 3 #Quiz 4 #Quiz 5 #Quiz 6
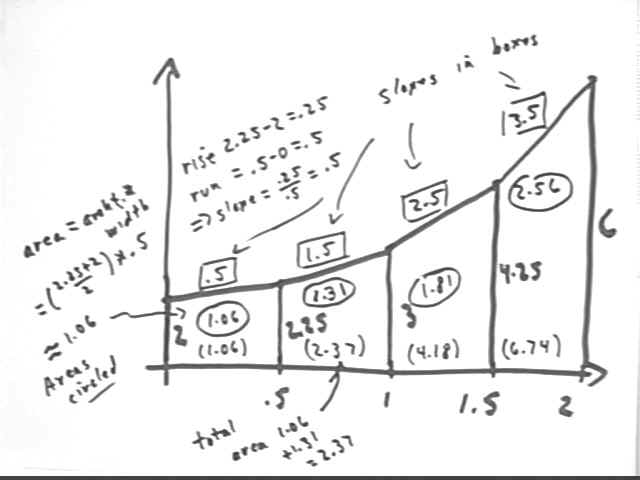
The Trapezoidal Approximation Graph pictured below represents the amount of water in a tank, in hundreds of gallons, vs. the number of hours since the start of a rainy day.
At what approximate average rate, in gallons / hour, is water accumulating in the tank around t = 1.25 hours?
What is the meaning of the number 4.25 on the graph?
What is the meaning of the number 1.5 on the graph?
If the above graph represents the rate, in centimeters per minute, at which the water level in a cylinder is changing, vs. the clock time in minutes then at what rate is the level changing at t = 1.5 minutes?
How much change is there in the depth of the water in the container between t = .5 and t = 1 minute?
How much change is there in the depth of the water in the container between t = .5 and t = 2 minutes?
What does the number 2.5 represent on this graph?
The Trapezoidal Approximation Graph pictured below represents the amount of money in your bank account, in thousands of dollars, vs. the number of months since you first started keeping track.
Interpret the altitudes, slope, width, area and accumulated area of the third trapezoid.
If the above graph represents the rate, in dollars / month, at which the amount of money in your bank account is changing, vs. the clock time in months since you started keeping track, interpret the altitudes, slope, width, area and accumulated area of the second trapezoid.
If the above graph represents the cross-sectional area of a container vs. the altitude above the floor at which the cross-section was measured, sketch the container and interpret the altitudes, slope, width, area and accumulated area of the fourth trapezoid.
The Trapezoidal Approximation Graph pictured below represents the velocity of an object, in meters / second, vs. clock time in seconds.
Interpret the altitudes, slope, width, area and accumulated area of the fourth trapezoid.
For the given graph sketch a graph of slope vs. clock time, and sketch another graph of accumulated area vs. clock time. What does each of these graphs mean?
The Trapezoidal Approximation Graph pictured below represents the cost, in millions of dollars per ton, of extracting gold from the mine you discovered in your backyard, vs. the number of tons that have been extracted (also called the amount depleted).
Interpret the altitudes, slope, width, area and accumulated area of the second trapezoid.
For the given graph sketch a graph of slope vs. amount depleted, and sketch another graph of accumulated area vs. amount depleted. What does each of these graphs mean?
The graph below represents the number of Aardvarks, in hundreds, participating in an effort to screw in a lightbulb, vs. the number of hours since lightbulb was first presented to the group. Each Aardvark is earning $10 / hour on a privately funded contract. How much does the attempt cost in the first 2 hours?
Interpret the altitudes, slope, width, area and accumulated area of the third trapezoid.
The graph below represents walking speed, in miles per hour, of a tired horse approaching the barn, vs. clock time in hours. What is the meaning of the slopes of the trapezoid? What is the meaning of the difference between the accumulated area of the second trapezoid and the accumulated area of the last?