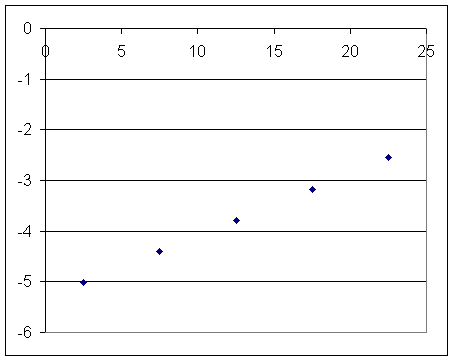
Our ave rate vs. midpt time for the quadratic function of the last assignment is as follows:
| midpt t | ave rate |
| 2.5 | -5.0212 |
| 7.5 | -4.4042 |
| 12.5 | -3.7872 |
| 17.5 | -3.1702 |
| 22.5 | -2.5532 |

To get the equation of the straight line defined by these points we can pick any two points and put their coordinates into the form y = m x + b, except that this is a graph of rate vs. t, not y vs. x.
Using y ' for rate and t for clock time we change the form to y ' = m t + b.
Putting our ( t, y ' ) coordinates into the form we get:
Use (2.5, -5.02) and (17.5, -3.1702).
We get
-5.0212 = m * 2.5 + b and
-3.1702 = m * 17.5 + b.
If we subtract the second equation from the first we get
-1.851 = -15 m
From this we divide both sides by -15 to get
m = .1234.
Plugging this into the first equation -5.0212 = m * 2.5 + b we bet
-5.0212 = .1234 * 2.5 + b. Solving for b we get
b = -5.3297.
So the equation of the line is
y ' = .1234 t - 5.3297.
Excel confirms this equation.
Using the ave rate vs. clock time calculations from the original function
depth y = 0.0617t^2 - 5.3297t + 91.713
we get
y ' = .1234 t - 5.3297.
We observe that the coefficient .1234 of t in the y ' equation is double that of t^2 in the y equation, and that the coefficient of t in the y equation appears by itself in the y ' equation.
Quiz:
For the quadratic function y(t) = .1 t^2 - b t + c, where b is the number of letters in your full name, what are the values of y(0), y(5), y(10) and y(15)? At what average rate does y change with respect to t for each of the three 5-second intervals implied by these values?
For me the function is y(t) = .1 t^2 - 5 t + c.
So y(0) = c, y(5) = 2.5 - 25+ c = -22.5 + c, y(10) = 10 - 50 + c = -40 + c and y(15) = ... = -52.5 + c.
To find ave rate of change we divide change in y by change in t. Changes in y and rates of change are:
t=0 to t=5 sec: `dy = (-22.5 + c) - c = -22.5 so rate is -22.5 / 5 = -4.5
t=5 to t=10 sec: `dy = (-40 + c) - (-22.5 + c) = -17.5 so rate is -17.5 / 5 = -3.5 (see footnote at end for details)
etc. (third rate is -2.5).
Sketch a graph of the average rate of change vs. the midpoint clock time of the interval.
Your graph will have a slope of .2, just as my graph would (with every 5-second interval ave rate increases by 1 so slope is 1/5).
We could plug in the ave rates and midpt clock times to evaluate m and t and thus get the rate function y ' = m t + b.
What is the expression for the change in your y(t) = .1 t^2 - 5 t + c function between clock time t and clock time t + `dt?
Note that `d means the Greek capital Delta (the triangle thing).
Value of y at t is y(t) = .1 t^2 - 5 t + c
Value of y at t + `dt is
y(t + `dt) = .1 (t + `dt)^2 - 5 (t + `dt) + c
We expand this then simplify to get
.1 ( t^2 + 2 t `dt + `dt^2) - 5 t - 5 `dt + c
= .1 t^2 + .2 t `dt + .1 `dt^2 - 5 t - 5 `dt
The change in y is
`dy = y(t + `dt) - y(t) =
[ .1 t^2 + .2 t `dt + .1 `dt^2 - 5 t - 5 `dt ] - [ .1 t^2 - 5 t + c ] =
.2 t `dt + .1 `dt^2 - 5 `dt
What is the expression for the average rate at which your y(t) function changes between clock time t and clock time t + `dt?
The average rate of change is `dy / `dt = [ .2 t `dt + .1 `dt^2 - 5 `dt ] / `dt = .2 t - 5 + .1 `dt.
Homework: What is the average rate of change of y = a t^2 + b t + c between clock times t and t + `dt? What happens to this expression as `dt shrinks toward zero?
Footnote:
(-40 + c) - (-22.5 + c)
These are the y values for t=10 and t=5.
We subtract the t=5 value from the t=10 value to get the change in y.
The algebra:
(-40 + c) - (-22.5 + c) = -40 + c - (-22.5) - c
= -40 + c + 22.5 - c = (-40 + 22.5) + c - c = -17.5.