Calculus I Quiz 0927
If a sand pile 4 meters high has a mass of 144000 kg, then what would we expect to be the mass of a geometrically similar sand pile 15 meters high? Using the differential estimate the mass of sand required to increase the height of the pile from 4 meters to 4.03 meters.
If y is mass and x the height then since mass occupies volume we have y = k x^3. Using the given information we have
144,000 kg = k * (4 m)^3 so
k = 144,000 kg / (4 m)^3 = 2250 kg / m^3.
Thus y = 2250 kg/m^3 * x^3 and if x = 15 m we have
y = 2250 kg / m^3 * (15 m)^3 = 7.6 million kg approx.
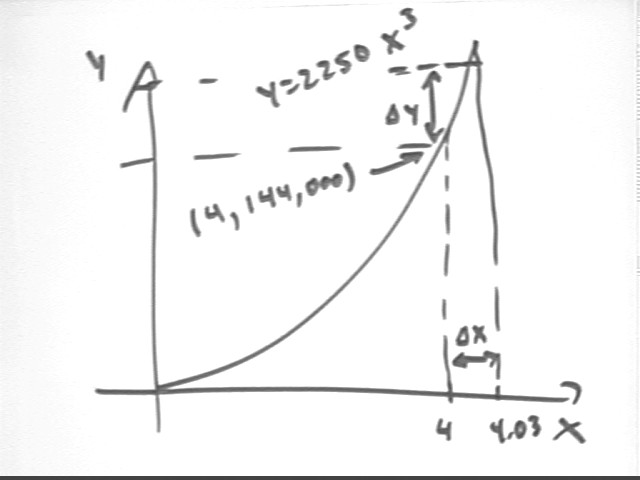
The differential is essentially a tangent-line approximation and you should use this picture. The figure below shows the y vs. x curve for the function y = 2250 x^3 and the point (4, 144000), with the interval from 4 to 4.03 depicted (not to scale).
The slope of the graph at the x = 4 point is given by the derivative function y ' = 3 k x^2, evaluated at x = 4.
COMMON ERROR: Don't evaluate the derivative function at x = .03. We have x interval `dx = .03, but x is 4 at the point we are given. It makes no sense at all, in terms of this graph, to evaluate the derivative function at x = .03, since nothing in this problem happens in the vicinity of x = .03.
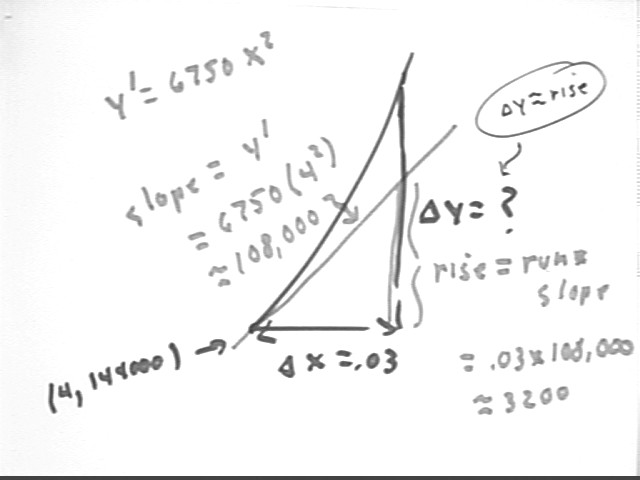
The figure below depicts the situation in the vicinity of (4, 144000).
The slope is y ' = 3 k x^2 evaluated at x = 4, which gives us about 108,000 kg / m. This is the slope of the graph, and also the rate at which mass is changing with respect to height at x = 4.
Assuming that this rate doesn't change appreciably between x = 4 and x = 4.03 we find that change = rate * `dx = 108,000 kg/m * .03 m = 3200 kg, approx.
Using differential terminology to say the same thing:
Since y ' = 3 k x^2 the differential is
`dy = 3 * 2250 kg/m^3 * x^2 * `dx, approx.
For `dx = .03 meters we have
`dy = 6750 kg/m^3 * (4 m)^2 * .03 m = 3200 kg, approx.
This is the change in the mass of the sandpile (a change of about 3200 kg).
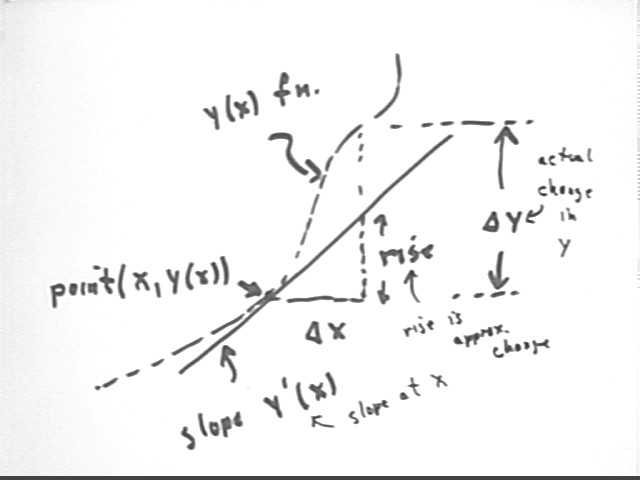
The figure below generalizes this process to a function y(x) near the point (x, y(x)). The actual change `dy differs from the change we get assuming constant rate of change y ' (x) (this is the rate of change or slope).
Assuming constant rate of change we get rise = y ' (x) `dx, which approximates `dy to the extent that y ' doesn't change much between x and x + `dx.
Thus we say that `dy = y ' (x) * `dx, approximately. This is the essence of a differential approximation.
Problem: Derive the expression for the derivative of the function y(t) = a t3 at clock time t.
The figure below depicts this derivation:
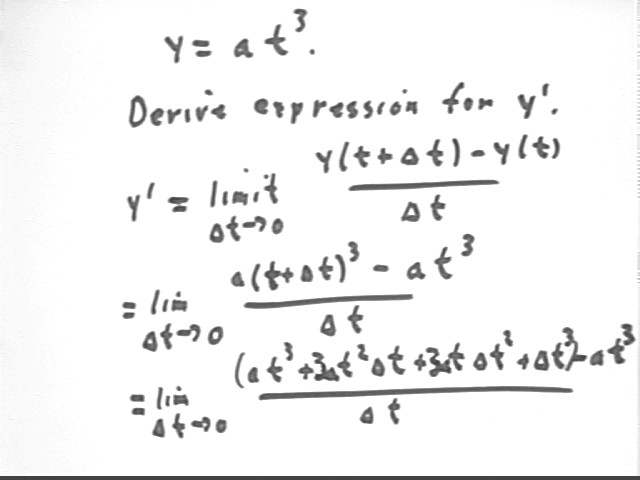
Repeating the above steps:
y(t + `dt) = a ( t + `dt)^3 = a ( t^3 + 3 t^2 `dt + 3 t `dt^2 + `dt^3) so that
[ y(t + `dt) - y(t) ] / `dt =
[ a t^3 + 3 a t^2 `dt + 3 t a `dt^2 + a `dt^3 - a t^3 ] / `dt =
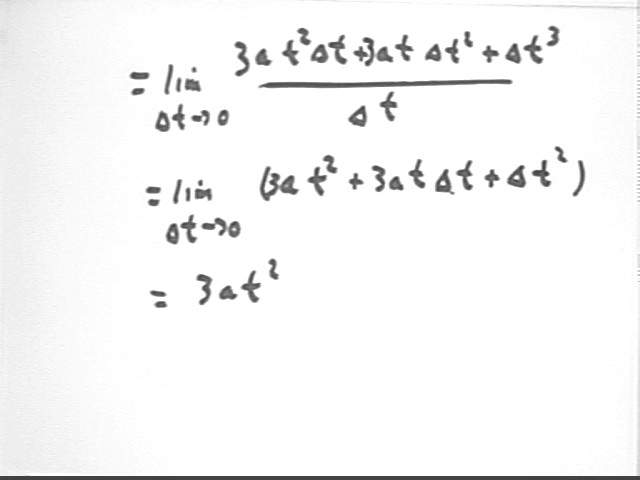
[ 3 a t^2 `dt + 3 t a `dt^2 + a `dt^3 ] / `dt =
3 a t^2 + 3 t a `dt + a `dt^2.
At `dt -> this expression approaches 3 a t^2.
Problem: If the rate of depth change is rate(t) = .042 t + -1.3, then what is the depth function if the depth at clock time t = 0 is 99? How long does it take for the depth to decrease from 82.87249 to 79.44964? What is the average rate at which depth changes over this period?
Depth function is y(t) = .021 t^2 - 1.3 t + c.
Since y(0) = c (plug in 0 and simplify) and y(0) = 99 so c = 99 and we have
y(t) = .021 t^2 - 1.3 t + 99.
Depth is 82.9 when .021 t^2 - 1.3 t + 99 = 82.9; rearranging and applying the quadratic formula we get t = 17.1 or 44.8 and choose the first value since this corresponds to the decreasing part of the quadratic.
Similar reasoning tells us that depth is 79.5 at t = 25.5.
So it takes `dt = 25.5 - 17.1 = 8.4 (presumably seconds) for the depth to make the specified change.
The average rate of depth change for this period is therefore
ave rate = change in depth / change in clock time =
(79.5 - 82.9) / (25.5 - 17.1) = 3.4 / 8.4 = .38 approx., presumably .38 cm/s.
The rate at which water flows from a certain nonuniform cylinder is given by rate = .02 t3 + -2.6 t cm3 per minute, where t is in minutes. How much do water do you think will flow between clock times t = 17.3 minutes and t = 34.4 minutes?
We could find the antiderivative .005 t^4 - 1.3 t^2 + c and evaluate at the two times, then subtract to find the actual change in depth. This gives the exact correct answer. For future reference: this would be an application of the Fund Thm of Calculus to find a definite integral.
However using an approximation we find that at t = 17.3 the rate is rate(17.3) = 58.6 and at t = 34.4 the rate is rate(34.4) = 724.7. The approximate average rate is therefore the average of the two rates, (724.7 + 58.6) / 2 = 392 approx. It's obvious that the rate function is far from linear so we don't have a lot of confidence in this approximation.
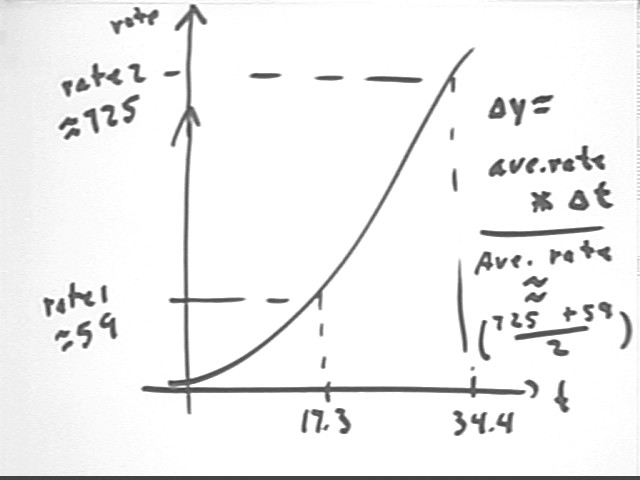
At this average rate during the time interval `dt = 34.4 - 17.3 = 17.1 we have `dy = ave rate * `dt = 392 * 17.1 = 6800 approx.
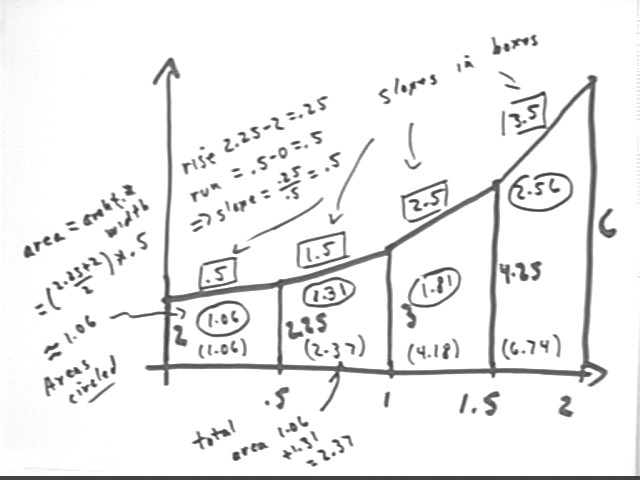
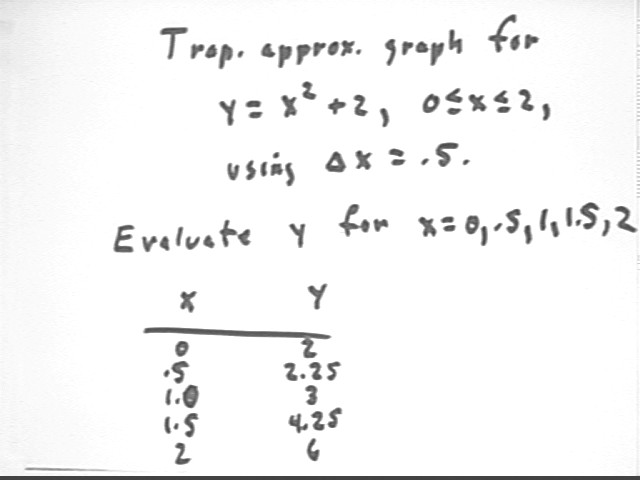
Sketch and label, according to conventions, a trapezoidal approximation graph for the function y = x^2 + 2 on the interval 0 <= x <= 2, using interval `dx = .5.
To move from x = 0 to x = 2 by interval `dx = .5 we use values x = 0, .5, 1, 1.5, 2.
We evaluate the function at x = 0, .5, 1, 1.5 and 2 and make a table:
To construct the graph we first label the x axis with the points 0, .5, 1, 1.5 and 2.
From each of these points we sketch a vertical segment whose length is equal to the value of the function at that x value. The length of the vertical segment, which is the corresponding value of the function, is indicated just to the right of the segment. The top of each vertical segment will lie at the corresponding graph point (x, y).
If we sketched a smooth curve through these points we would have a graph representing the function. Instead of a smooth curve we do a trapezoidal approximation, sketching a straight line segment from point to point. This forms a series of four trapezoids; the line segments in this case are a good, if not perfect, approximation to the actual curved graph.
For the segment at the top of each trapezoid we calculate the slope of that segment. We first calculate the rise and run of the segment, then divide to obtain the slope, as indicated for the first segment. The slope is labeled along the segment and to distinguish it from other numbers we enclose it in a rectangular box. Slopes are labeled for all trapezoids.
We also calculate the area of each trapezoid, calculating average 'height' by width. The calculation is shown for the first trapezoid. The areas of the trapezoids are indicated inside the appropriate trapezoids and circled.
We finally calculate the 'accumulated area' through the end of each trapezoid. For each trapezoid this is the area of all trapezoids to the left of the rightmost point of the trapezoid. For example for the second trapezoid, whose rightmost point is 1, we have the first and second trapezoids with areas 1.06 and 1.31 to the left of this point and the accumulated area is therefore 1.06 + 1.31 = 2.37. The accumulated area is indicated in parentheses within each trapezoid.