Calculus I Quiz 1002
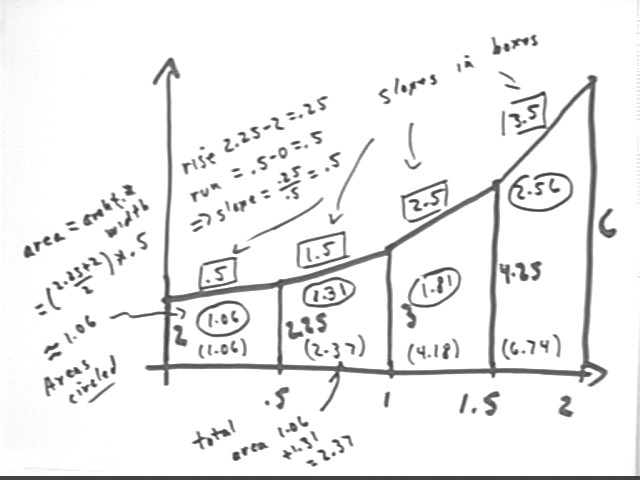
The Trapezoidal Approximation Graph pictured below represents the amount of money in your bank account, in thousands of dollars, vs. the number of months since you first started keeping track.
Interpret the altitudes, slope, width, area and accumulated area of the third trapezoid.
Altitude represents amount of money in thousands of dollars.
Slope is rise / run. Rise is change in amount of money, run is change in clock time so slope is change in amount / change in clock time = ave rate of change of amount in thousands of dollars per month.
Width represents change in clock time.
Area is ave altitude * width, representing ave amount of money * change in clock time, which might be some measure of how much and for how long you enjoy your money; alternatively it is proportional to how much interest you earn.
Accumulated area could be a measure of accumulated enjoyment, or more significantly it will be proportional to the total interest earned over the given time interval.
If the above graph represents the rate, in dollars / month, at which the amount of money in your bank account is changing, vs. the clock time in months since you started keeping track, interpret the altitudes, slope, width, area and accumulated area of the second trapezoid.
Altitudes represent the rate at which money accumulates in dollars/month.
Slope = rise/run; rise represents the change in the rate of accumulation, run represents the change in clock time, so slope represents change in rate / change in clock time, which is the average rate at which the rate is changing for the given time interval.
Width represents change in clock time.
Area = ave altitude * width. Ave altitude represents the average of the two rates, which is a linear approximation to the actual average rate. Width represents change in clock time so that area represents approx. ave rate * change in clock time = approx. change in amount of money, in thousands of dollars / month * months = thousands of dollars.
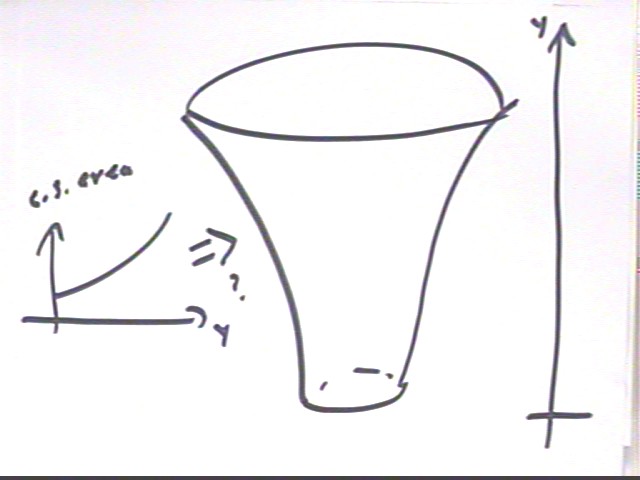
If the above graph represents the cross-sectional area of a container vs. the altitude above the floor at which the cross-section was measured, sketch the container and interpret the altitudes, slope, width, area and accumulated area of the fourth trapezoid.
Graph 'altitudes' represent cross-sectional areas, and
'altitudes' are increasing on the graph. So the container has to get wider
as altitude above floor increases. (To avoid confusion between graph
altitude and altitude in the container, let's use 'vertical position' for when
referring to altitude in the container).
A possible graph is shown below (note, however, that a deeper analysis would indicate that the sides are actually straight, though sloping outward from the center--the figure would be a section of a cone).
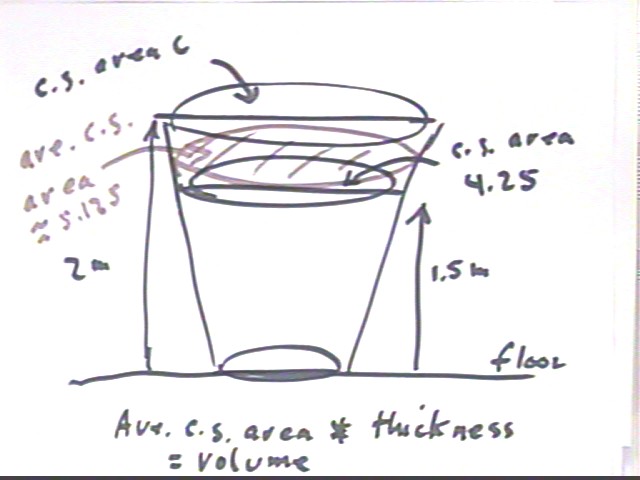
Graph slope is rise / run; rise is the change in cross-sectional area, run is change in vertical position. So slope = change in cs area / change in vertical position, or the ave rate at which cs area is changing with respect to vertical position.
Graph width represents change in vertical position.
Graph area represents ave. trapezoid altitude * trapezoid width. Ave trapezoid altitude represents the average of the two cross-sectional areas, which is an approximation to the average cross-sectional area. Trapezoid width represents change in vertical position, or difference in the two vertical positions represented by the trapezoid.
Thus graph area represents
ave cross-sectional area * difference in vertical coordinates
= ave cross-sectional area * thickness
= volume of 'slice' between vertical positions 1.5 and 2.
For 4th trapezoid ave c.s. area is (4.25 + 6 ) / 2 = 5.125. Let's say this is in cm^2. Change in vertical coordinate is 2 - 1.5 = .5. Let's say this is in cm. Then trap area represents 5.125 cm^2 * .5 cm = 2.5625 cm^3, the approximate volume of the 'slice' between altitude 1.5 cm and 2 cm.
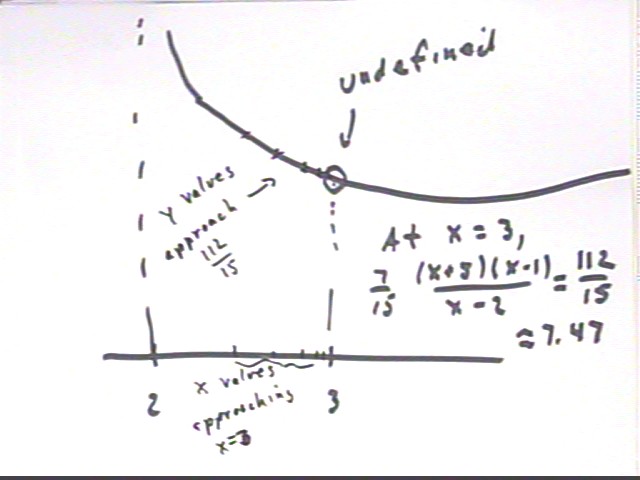
Continuing with the rational function
7/15 * ( x+5)(x-1)(x-3) / [ (x-2)(x-3) ].
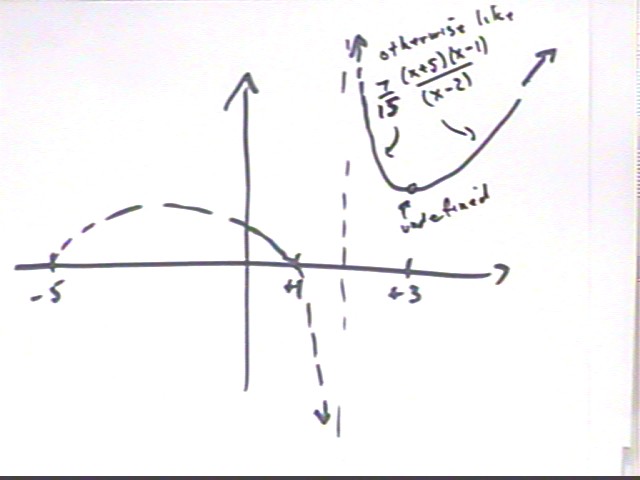
We had determined that the graph has zeros at -5, 1, 3 and a vertical asymptote at x = -2, which it approaches through negative values on the left and positive values on the right.
We also determined that near x = 3 the function behaves just like 7/15 * ( x+5)(x-1) / [ (x-2) ], but that the function is not defined at x = 3.
For x < -5 we see that there is no further opportunity to cross the x axis, and we note that when x is a very large negative number so is 7/15 * ( x+5)(x-1)(x-3) / [ (x-2)(x-3) ], since each of the five factors is a large negative number and since the degree of the numerator exceeds the degree of the denominator.
If x is a large positive number we similarly conclude that 7/15 * ( x+5)(x-1)(x-3) / [ (x-2)(x-3) ] must be a large positive number, all factors being positive and the degree of the numerator exceeding the degree of the denominator.
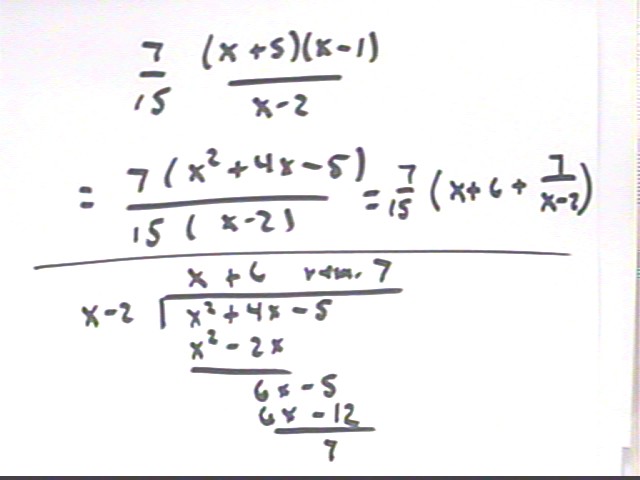
Long division shows that 7/15 * ( x+5)(x-1)(x-3) / [ (x-2)(x-3) ] = 7/15( x + 6 + 7 / (x-2) ). For large x, 7 / (x-2) is insignificant and the value of the function is close to 7/15(x+6). Closer to x = 2 the 7 / (x-2) becomes dominant.
Approximate graph:
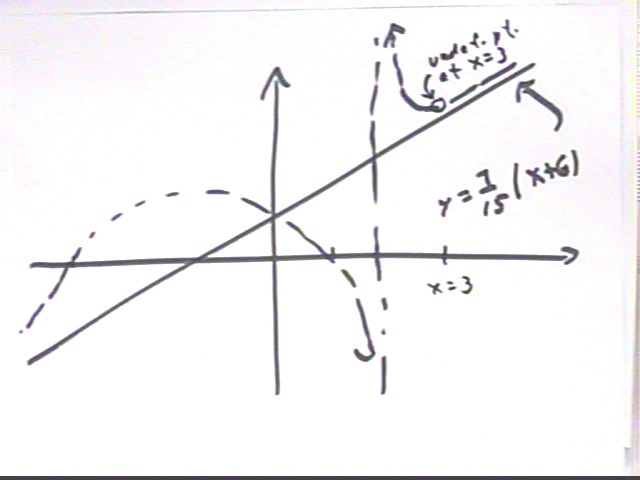
Actual graph, which doesn't indicate the undefined point at x = 3. Note the two asymptotes, the line 7/15 * (x+6) and x = 2.
As x -> 3, we see that y -> 112/15, since for any x value near but not equal to 3 the function is equal to 7/15(x+5)(x-1)/(x-2), which has value 112/15 at x = 3.