Calculus I Quiz 1007
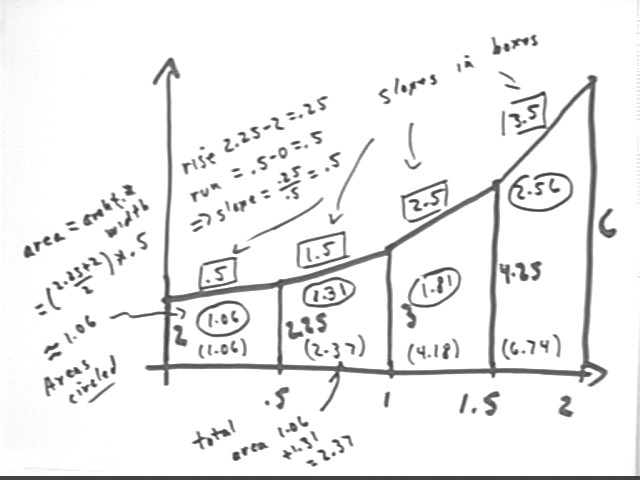
The Trapezoidal Approximation Graph pictured below represents the velocity of an object, in meters / second, vs. clock time in seconds.
Interpret the altitudes, slope, width, area and accumulated area of the fourth trapezoid.
The altitudes 4.25 and 6 represent velocities of 4.25 m/s and 6 m/s at clock times 1.5 sec and 2 sec.
The slope of this trapezoid represents rise / run = change in graph altitude / graph width. Change in graph altitude is from 4.25 m/s to 6 m/s, a change of 1.75 m/s, representing change in velocity. Width is .5 sec, representing the .5 sec during which the velocity change occurs. Slope therefore represents change in velocity / change in clock time = 1.75 cm/s / (.5 s) = 3.5 cm / s^2, which is the average rate of change of velocity during the time interval. Rate of change of velocity is acceleration.
The area of the trapezoid represents ave graph altitude * graph width. Ave graph altitude represents the ave. velocity (4.25 m/s + 6 m/s) / 2 = 5.125 m/s during the time interval from clock time 1.5 s to 2.0 s; trapezoid width represents the .5 s time interval between these clock times. Thus trapezoid area = ave graph altitude * trapezoid width = 5.125 m/s * .5 s = 2.56 m, approx., represents the product of average velocity and time interval, or approximate displacement during the time interval.
Accumulated areas therefore represent the total displacement since the t = 0 instant.
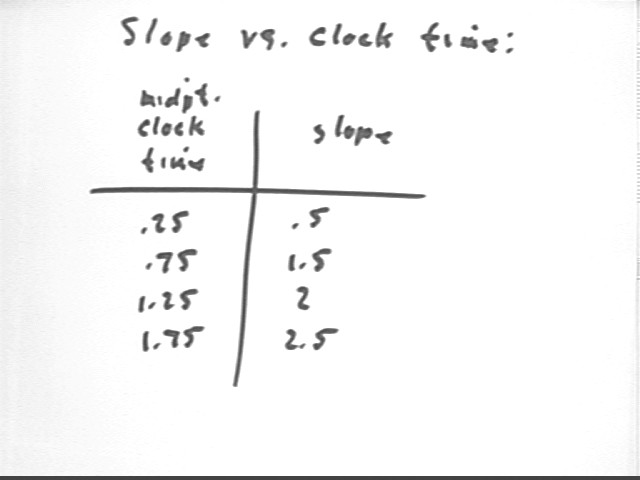
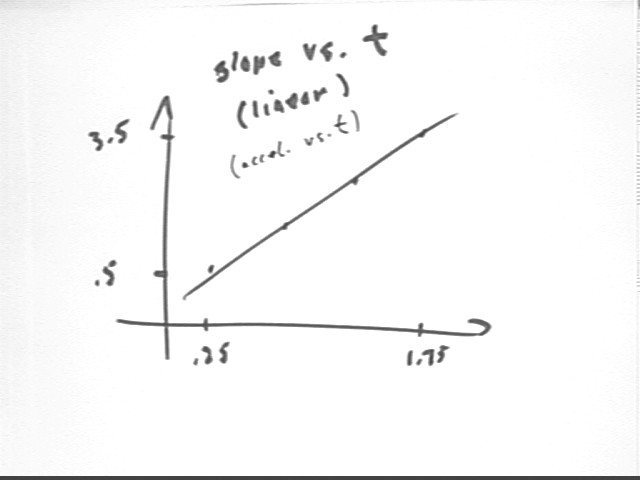
For the given graph sketch a graph of slope vs. clock time, and sketch another graph of accumulated area vs. clock time. What does each of these graphs mean?
Slopes represent rates of velocity change so the graph of slope vs. clock time is linearly increasing, and represents rate of change of velocity vs. clock time, i.e., acceleration vs. clock time.
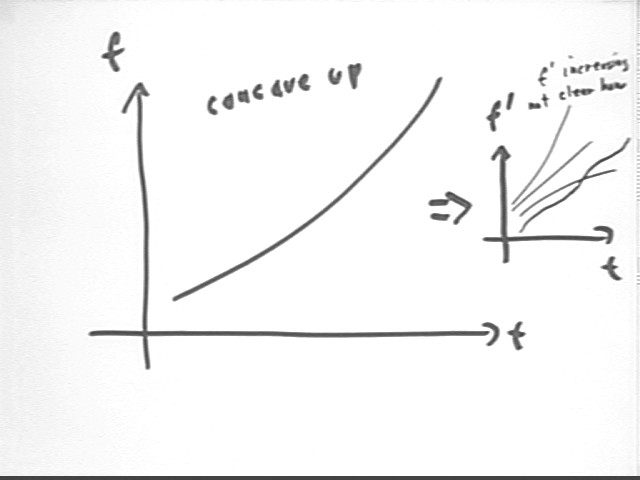
We note that if the graph of f(t) is concave up, then its slopes are increasing and its 'slope graph', which is the graph of f ' (t) vs. t, must be increasing. Several possible graphs of f ' (t) vs. t are indicated on the f ' vs. t graph below. We have no way of knowing just by looking at a sketch whether f ' vs. t is linear, as it was in the preceding example, concave up, concave down or alternating between upward and downward concavities, though if our information allows us to do so we could construct trapezoidal approximations that would allow us to determine which is the case.
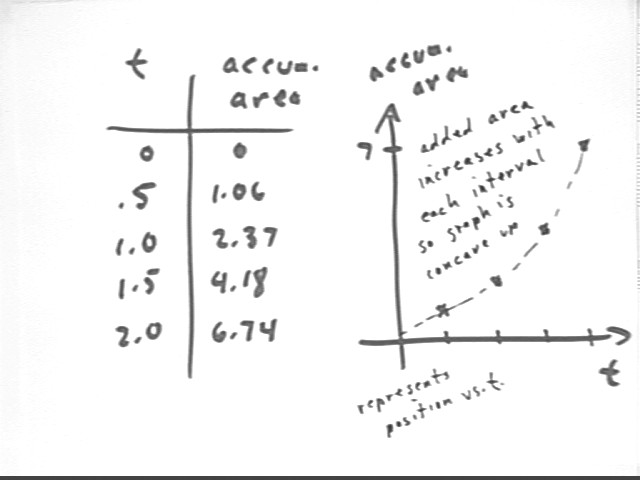
Accumulated area vs. clock time represents total displacement since t = 0 vs. clock time -- i.e., position vs. clock time, with position measured relative to the t = 0 position. A table and graph corresponding to the given trapezoidal approximation graph are shown below.
We note that since the original graph is increasing, the area added by each trapezoid is increasing and the accumulated area graph will be increasing at an increasing rate, i.e., will be concave up.
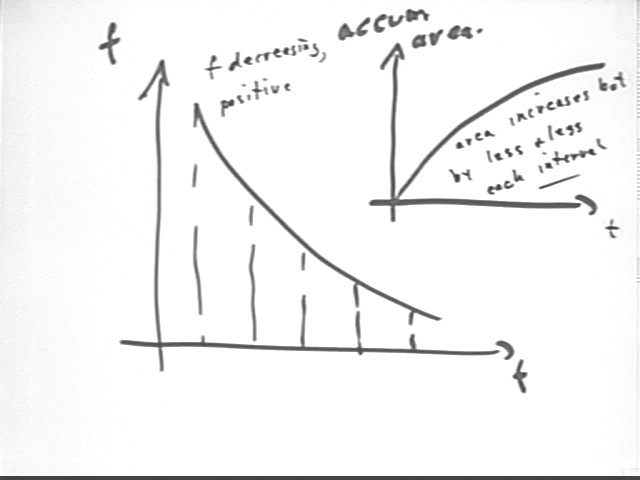
The graph below shows a function f(t) which is positive but decreasing. Since the function is positive its trapezoidal areas are positive so its accumulated areas would increase, as is the case for the accumulated area graph indicated at upper right. However the function f is decreasing, so the added trapezoidal areas are decreasing and the accumulated areas will increase by less and less with each new trapezoid, so that the graph increases at a decreasing rate, which makes the graph concave down.
We define f(x) to be (x-3) * (x-2) / (x - 2) whenever x is not equal to 2, and define f(x) be 12 when x = 2. Prove whether the function is or is not continuous at x = 2.
We note that for all x except x = 2, we can divide x-2 by x-2 and get f(x) = x-3. When x = 2 we can't do this because 0 / 0 is undefined. At x = 2 we've arbitrarily chosen y = 12. The graph is depicted in the figure below.
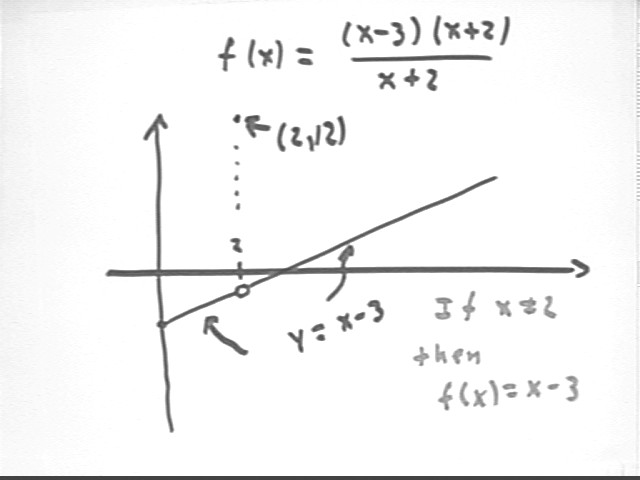
.Clearly from the graph this function is not continuous--it makes a 'jump' from y values close to x-3 = 2-3 = -1 all the way to y = 12, right at the point where x = 2.
Discontinuity results from the fact that f(x) values 'near' x = 2 are not near the value assigned to f(x) when x = 2.
Had we defined f(x) at x = 2 to have value -1 then the function would have been continuous--as we get close to x = 2 the y values would have been close to -1, and the closer the x values get the closer the y values would get. We could therefore remove the discontinuity by changing the definition of f(x) at that one point. We call such a discontinuity a removable discontinuity.
Water flows from a uniform cylinder with two holes, both well below the surface of the water. One of the holes in instantaneously plugged. Will the depth function y(t) be continuous or not for a time interval before and after the plugging? What about the rate-of-depth-change function y ' (t)?
The outflow for each hole is a quadratic fn. of clock time, so the depth function before plugging is the sum of two quadratics. This changes to only one of the quadratics at the instant of plugging, as shown in the figure below.
This single quadratic will have different concavity and different slope than the original sum of two quadratics, so the depth function suddenly changes slope but there's no sudden change in depth. So the depth function is continuous.
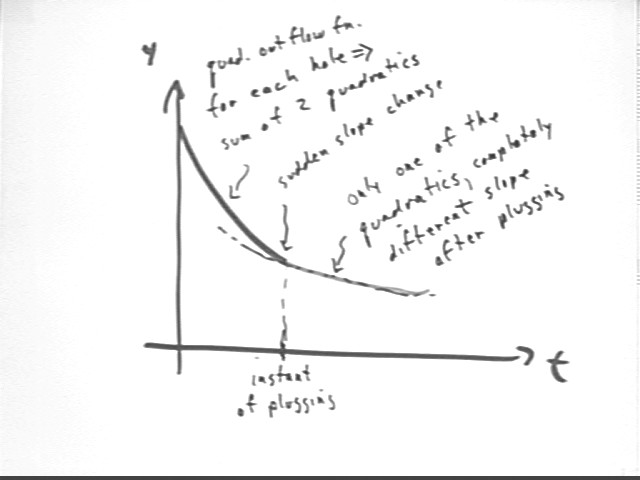
y ' (t) represents the rate of change of depth, indicated by the slope of the graph. Changing in an instant from one quadratic depth fn to another we make an instantaneous change in rate of depth change, or slope, so the rate fn. is not continuous at this instant.
Easy example: suppose the first quadratic was the sum of .2 t^2 - 5 t + 7 and .1 t^2 - 3 t + 12 and the second is just .1 t^2 - 3 t + 12. The rate function will change from .6 t - 8 to .2 t - 3. For almost any value of t these rates will be very different, revealing the discontinuity in rates.
ANOTHER INTERPRETATION OF THE TRAP. GRAPH GIVEN IN THE QUIZ: If the above trapezoidal approximation graph represents the net force F in Newtons vs. position x in meters exerted on a 5-kg object as it is pulled upward. The object is initially at rest at position x = 0. The forces are 2 N, 2.25 N, 3 N. 4.25 N and 6 N at positions 0, .5, 1, 1.5 and 2 meters.
Work is defined as the product of average force and displacement, and the kinetic energy of an object which starts from rest is equal to the total work done by the net force from the starting position to the present position.
What is the kinetic energy of the object at each of these positions 0, .5, 1, 1.5 and 2 meters.
The work done on the object by the net force thru a displacement `ds is `dW = Fave * `ds. Since each trapezoid has an average altitude which represents approximate Fave and a width which represents `ds, the area of each trapezoid represents approximate Fave * `ds = `dWbyNet by the net force on that interval. Units will be in Newtons * meters = Joules.
On the first interval we have `dWbyNet = 1.06 Joules. Since the object starts from rest at position x = 0 this will represent its KE at position x = .5 m.
On the second interval we have `dWbyNet = 1.31 J. This will be the change in KE on the second interval, on which it starts with KE of .106 Joules. It therefore ends the second interval with 1.06 J + 1.31 J = 2.37 J.
We see that the area of each trapezoid will be added to the areas of preceding trapezoids to give us the KE at the 'end' of that trapezoid. We get KE 4.18 J at x = 1.5 m and 6.74 J at x = 2 m.
Assignments for this week: