Calculus I Quiz 1009
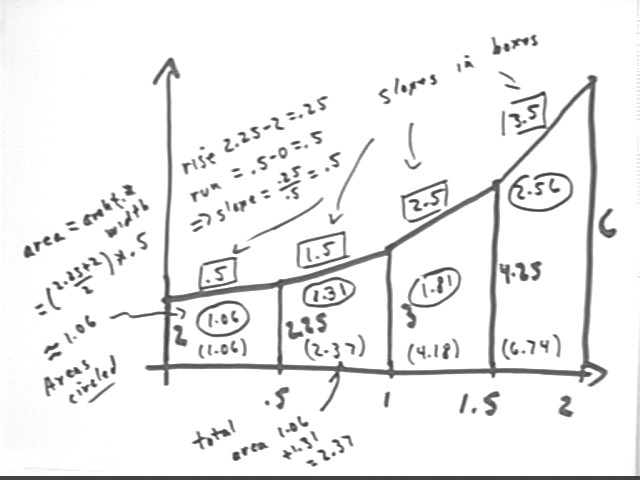
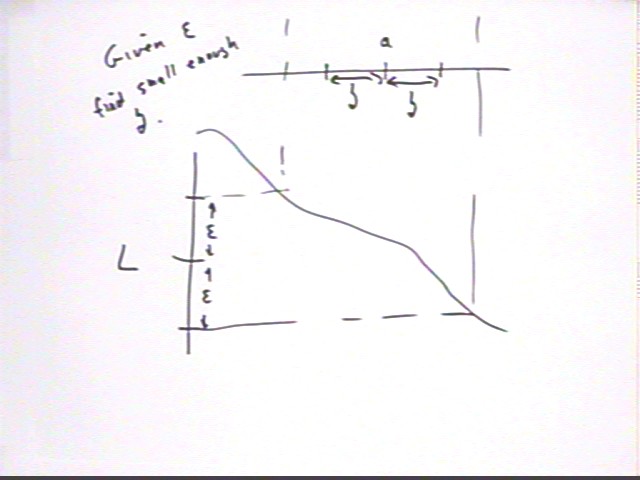
The Trapezoidal Approximation Graph pictured below represents the cost, in millions of dollars per ton, of extracting gold from the mine you discovered in your backyard, vs. the number of tons that have been extracted (also called the amount depleted).
Interpret the altitudes, slope, width, area and accumulated area of the second trapezoid.
Altitude is cost per ton.
Slope is rise / run; rise represents change in per-ton cost and run the change in the number of tons depleted. So slope represents change in per-ton cost / (change in tons depleted), in millions of dollars / ton^2. This is the rate at which unit cost is increasing with respect to amount extracted.
Area is ave trap altitude * trap width. Altitudes represent per-ton costs so ave altitude represents aproximate average per-ton cost, and width represents number of tons extracted at this average cost. So area represents ave cost per ton * number of tons extracted = cost of extraction.
Accumulated area is the total cost of extraction, from the initial extraction through the amount depleted.
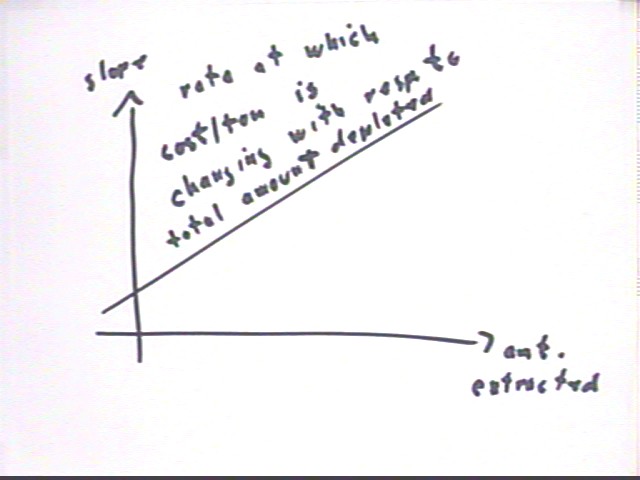
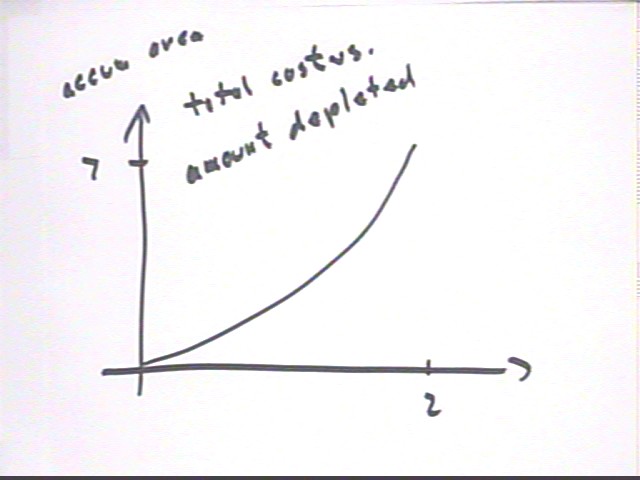
For the given graph sketch a graph of slope vs. amount depleted, and sketch another graph of accumulated area vs. amount depleted. What does each of these graphs mean?
We define f(x) to be (x-3) * (x-2) / (x - 2) whenever x is not equal to 2, and define f(x) be 12 when x = 2.
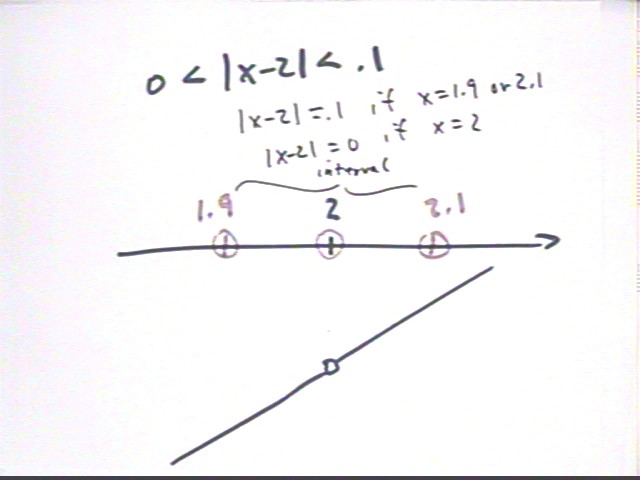
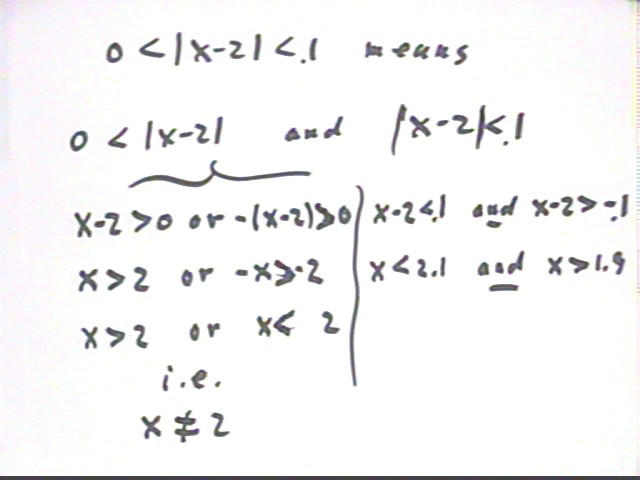
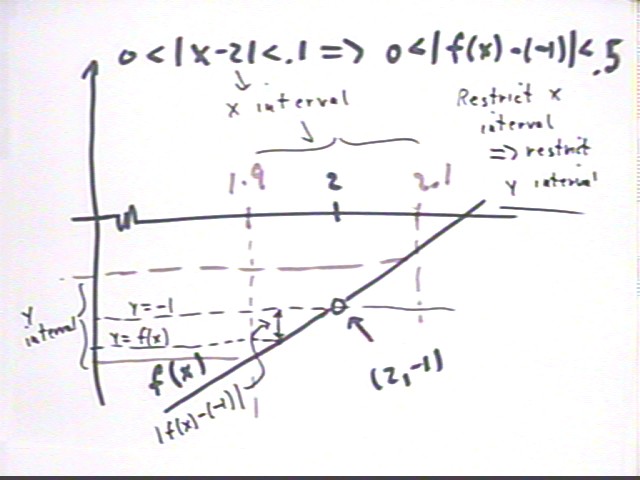
If 0 < | x - 2 | < .1 then x is not equal to 2, and f(x) simplifies to just x-3.
The interval 0 < | x - 2 | < .1 can be expressed as 1.9 < x < 2.1, with x = 2 excluded.
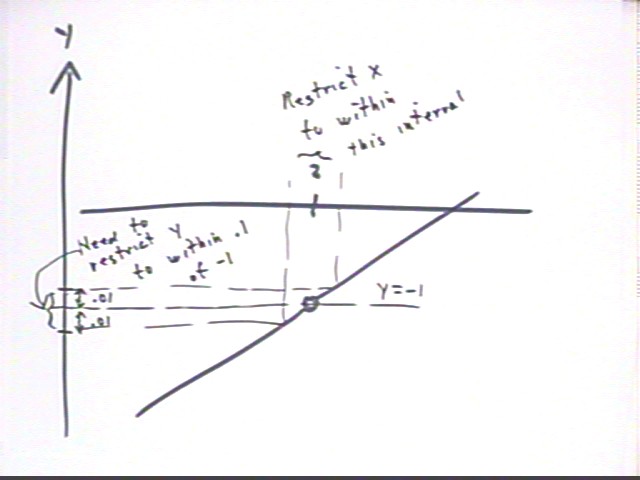
f(x) - (-1) = f(x) + 1 = x-3 + 2 = x-2, for all x except x=2. We thus want to show that | x - 2 | < .5
Since 1.9 < x < 2.1, adding -2 to both sides gives us
1.9 - 2 < x - 2 < 2.1 - 2 or
-.1 < x - 2 < .1, which is the same as
| x - 2 | < .1.
Since | x - 2 | < .1, we know that | x - 2 | < .5.
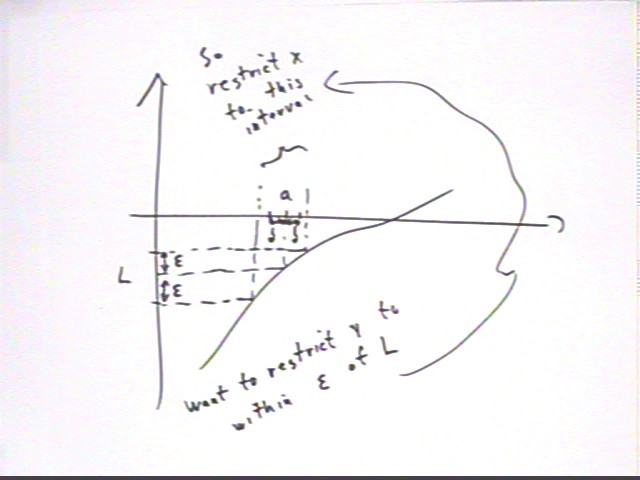
If 0 < | x - 2 | < delta then
-delta < x - 2 < delta