Calculus I Quiz 1011
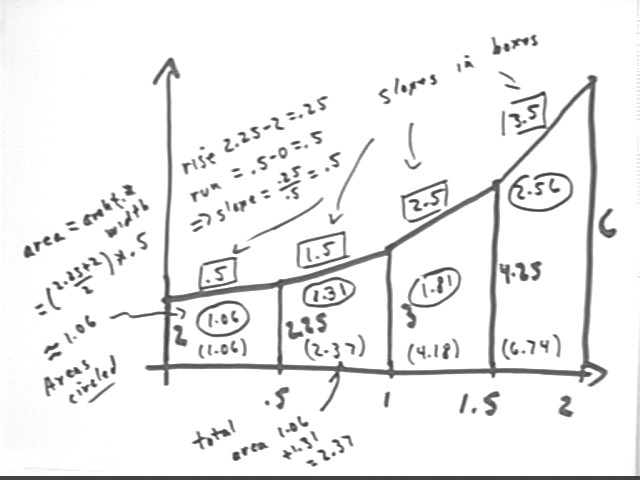
The graph below represents the number of Aardvarks, in hundreds, participating in an effort to screw in a lightbulb, vs. the number of hours since lightbulb was first presented to the group. Each Aardvark is earning $10 / hour on a privately funded contract. How much does the attempt cost in the first 2 hours?
Interpret the altitudes, slope, width, area and accumulated area of the third trapezoid.
Altitudes represent number of aadrvarks, in hundreds. The altitudes of the third trapezoid tell you that at t = 1 hr there are 3 hundred aardvarks and at t = 1.5 hr there are 4.25 hundred aardvarks working on the project.
Slope represents rise / run, or change in # of aardvarks / change in clock time, giving us the rate, in hundreds of aardvarks per hour, at which aardvarks are joining the project.
Area is ave altitude * width, representing ave # of aardvarks * time interval, giving the hundreds of aardvark * hours corresponding to a trapezoid. The area of the third trapezoid is 1.81, representing 1.81 hundred aardvark hours. This is equivalent to 181 aardvarks working 1 hour each (calculated from the fact that we have an average of 362 aardvarks working for 1/2 hour) and is the basis for the wage cost. The third trapezoid is going to cost 181 aardvark hours * $10 / aardvark-hour = $1810.
Accumulated areas give us accumulated aardvark hours which allows us to compute total cost between two clock times.
At x = 3 the value of the function y = .3 x + .5 is 1.4. We wish to confine y to an interval between 1.4 - epsilon and 1.4 + epsilon by confining x within some interval centered at x = 3.
The graph below depicts the function y = .3 x + .5.
1.4 - epsilon < y < 1.4 + epsilon. We add -1.4 to each expression to get
-epsilon < x - 1.4 < epsilon, which is equivalent to
| y - 1.4 | < epsilon.
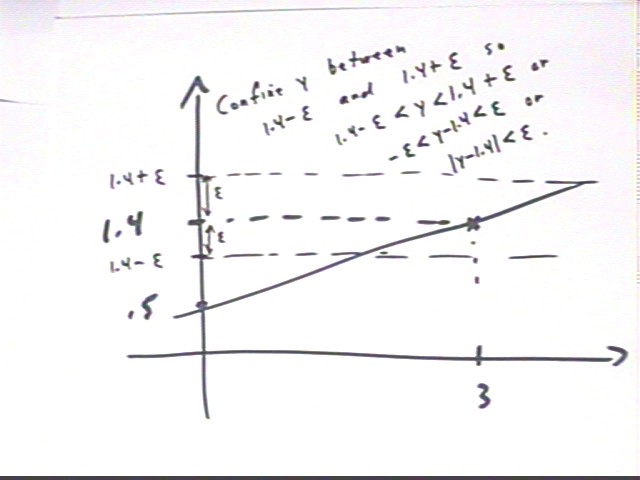
In terms of the graph we see that the horizontal strip between y - epsilon and y + epsilon corresponds to the inequality | y - 1.4 | < epsilon. We wish to restrict x values so that the y values on the graph of y = .3 x + .5 lie in the region | y - 1.4 | < epsilon, i.e., in the horizontal strip that lies within epsilon of y = 1.4.
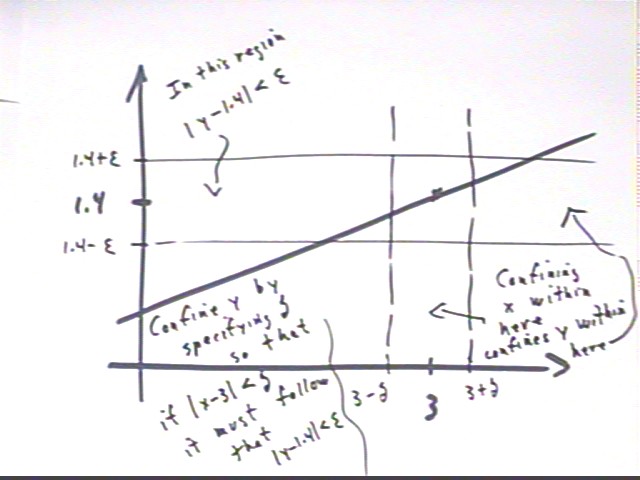
The region between 3 - delta and 3 + delta, as shown on the graph, accomplishes this. We see that for all graph points lying in the vertical strip for which 3 - delta < x < 3 + delta, the y values lie in the horizontal strip | y - 1.4 | < epsilon.
Note that the region 3 - delta < x < 3 + delta can be expressed by the inequality | x - 3 | < delta. So whenever | x - 3 | < delta, we have | y - 1.4 | < epsilon.
If epsilon = .1, give the endpoints of such an x-interval.
Give a value of delta such that y is confined to the given epsilon-interval about 1.4 provided x lies within delta of x = 3.
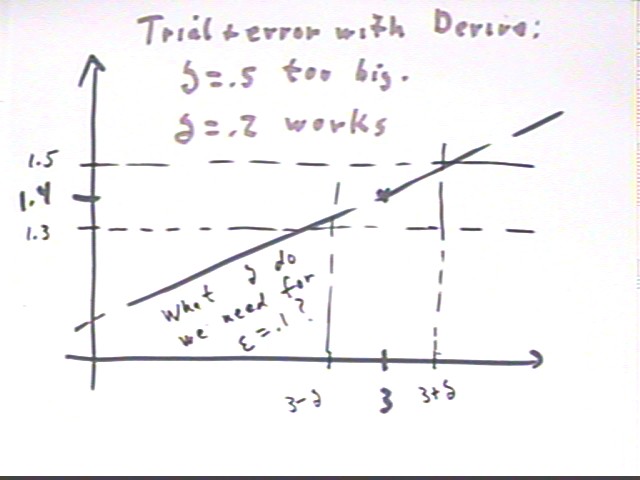
The graph shown above doesn't specify the value of delta, or of epsilon. Given the value of epsilon we can find a value of delta that satisfies this condition using algebraic means. However we first illustrate the situation with graphs constructed by a computer algebra system.
For epsilon = 1 the inequality | y - 1.4 | < epsilon corresponds to y values between 1.3 and 1.5. The graph shown below depicts the graph of y = .3 x + .5, with the horizontal lines y = 1.3 and y = 1.5. Note that there exists a vertical strip to the right and left of x = 3 for which the graph lies in the horizontal strip between y = 1.3 and y = 1.5. We wish to find a value of delta such the the region | x - 3 | < delta defines such a region.
The graph below depicts a vertical strip running from x = 2.5 to x = 3.5, i.e., the strip | x - 3 | < .5. Note that this strip is not narrow enough to confine y values to the desired horizontal strip.
A closer view near the point (3, 1.4), showing that the interval from x = 2.5 to x = 3.5 fails to confine y to within .1 of 1.4. That is, | x - 3 | < .5 does not succeed in guaranteeing that | y - 1.4 | < .1, so a delta of .5 does not guarantee and epsilon of .1.
The interval from x = 2.8 to x = 3.2 does confine y to within .1 of 1.4, as depicted below. Thus to guarantee that | y - 1.4 | < .1 we can confine x to the region | x - 3 | < .2. An epsilon of .1 is guaranteed by a delta of .2.
![]()
So we see by trial and error that delta = .5 is too large, but that delta = .2 words.
Delta can actually be somewhat larger than .2--we don't have to restrict x quite that close to 3 in order to achieve the desired restriction on y. While it's not necessary to do so we can in fact find the largest possible delta for this situation:
Starting with the inequality | y - 1.4 | < .1 and given the function y = .3 x + .5, we can arrive and an equivalent inequality for x. We first write | y - 1.4 | < .1 as -.1 < y - 1.4 < .1
-.1< y - 1.4 < .1 ; adding 1.4 to both sides we have
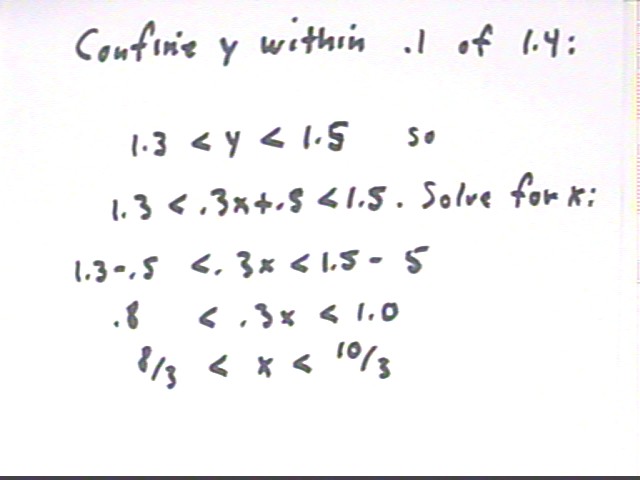
1.3 < y < 1.5. Since y = .3 x + .5 we have
1.3 < .3 x + .5 < 1.5 so that
.8 < .3 x < 1.0 and
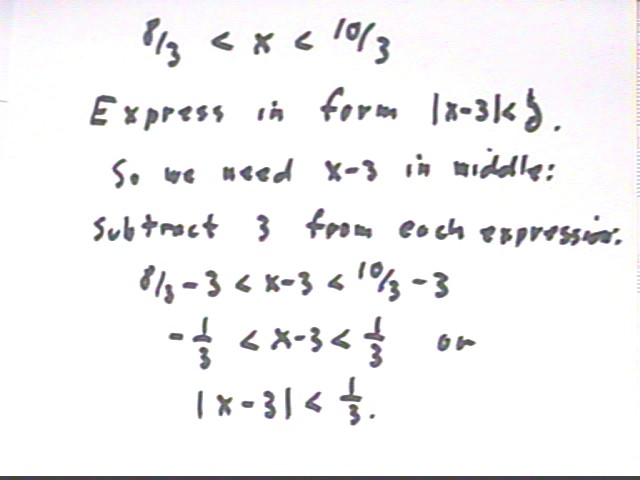
8/3 < x < 10/3 so that
8/3 - 3 < x - 3 < 10/3 - 3 or
-1/3 < x - 3 < 1/3 so that
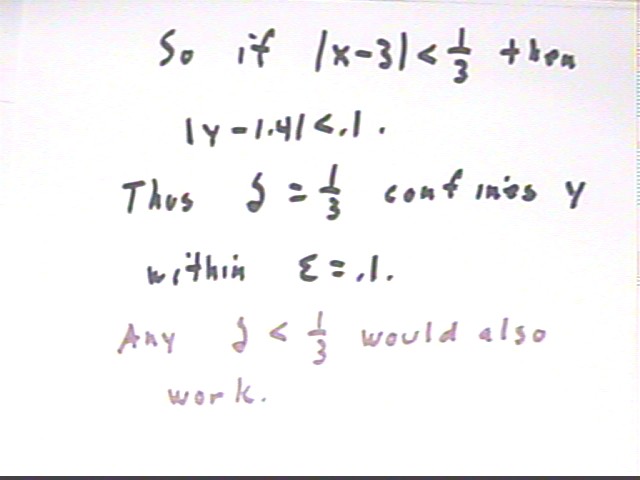
| x - 3 | < 1/3 or in decimal form
| x - 3 | < .333... .
This interval, 8/3 < x < 10/3 or equivalently | x - 3 | < 1/3 or | x - 3 | < .333..., is shown below:
Thus for epsilon = .1, any delta which is 1/3 or less (including the .2 we found by trial and error) will work.
Summarizing the same details:
For an arbitrary epsilon give a value of delta such that whenever x lies within delta of 3, y must lie within epsilon of 1.4.
This means that we want to find an expression for delta in terms of the symbol epsilon. We start with the desired inequality | y - 1.4 | < epsilon, which we rewrite as
-epsilon < y - 1.4 < epsilon or as
1.4 - epsilon < .3 x + .5 < 1.4 + epsilon. Solving for x we get
(.9 - epsilon) / .3 < x < (.9 + epsilon) / .3 so that
3 - 10/3 epsilon < x < 3 + 10/3 epsilon or
-10/3 epsilon < x - 3 < 10/3 epsilon so that
| x - 3 | < 10/3 * epsilon or in decimal form
| x - 3 | < 3.333... * epsilon.
That is, if delta = 10/3 * epsilon then whenever | x - 3 | < delta we have | y - 1.4 | < delta.
Now consider the graph below, showing the function defined by y = .3 x + .5 for x < 3 and as y = .3 x + .6 for x > 3. We note that the difference in the two functions, if evaluated at x = 3, is .1. As x approaches 3 from the left the limiting value of the function is 1.4 while if x approaches from the right the limiting value is 1.5. This of course shows us immediately that the limit of the function does not exist at x = 3. However we are going to illustrate how the epsilon-delta approach leads to the same conclusion.
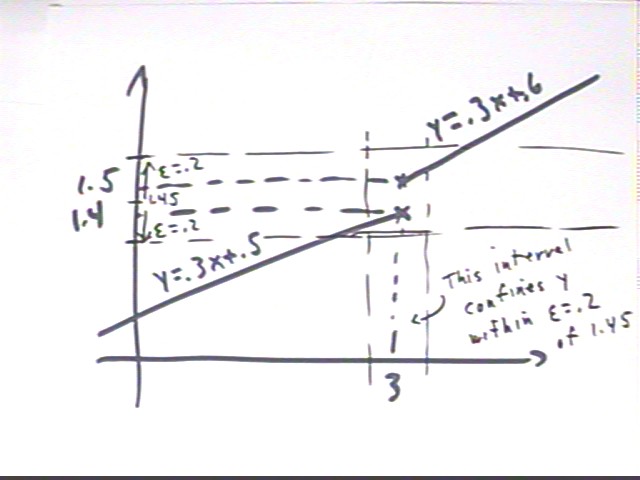
Show graphically that by choosing an appropriate delta we can confine y to within .2 units of 1.45.
The given function, and the horizontal strip corresponding to | y - 1.45 | < .2 is depicted in the graph below. Since as x -> 3 the graphs both approach to within .05 units of y = 1.45 any vertical strip containing 3 must contain y values within .2 of 1.45.
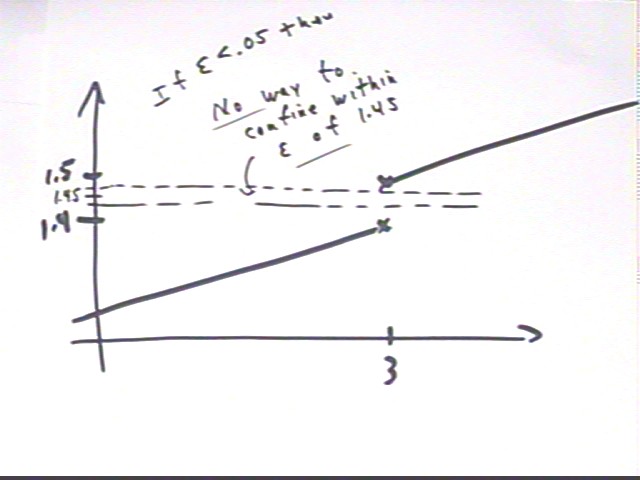
Show that for any epsilon < .05 it is not possible to confine the function to the strip | y - 1.45 | < epsilon.
The function to the left of x = 3 never exceeds 1.4 and the function to the right is never less than 1.5. For any epsilon < .05, | y - 1.45 | < epsilon will not contain any y values as great as 1.5 or greater than 1.4. So it will not be possible to confine y values to this strip.
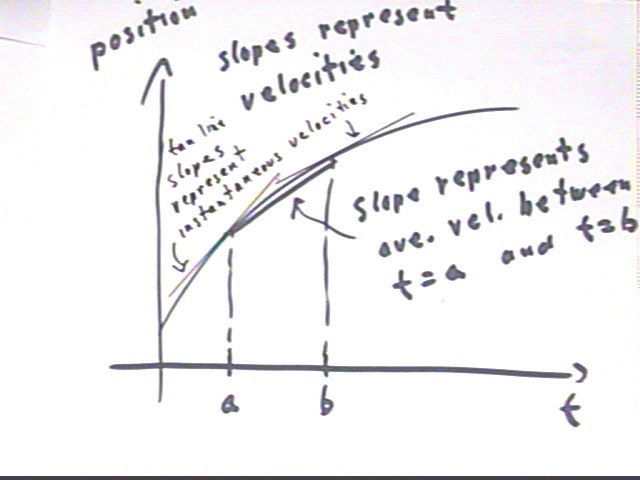
On a graph of position vs. clock time we note that the slope of the chord between two points t = a and t = b represents rise / run = change in position / change in clock time = average velocity. This is easily seen by interpreting the trapezoid in the figure below.
If we imagine narrower and narrower trapezoids containing the t = a point, we see that the curve of the function has less and less room to change the slope, so that the top of the trapezoid makes a better and better approximation of the function. In the limit as the width of the trapezoid approaches zero, the limiting slope of the trapezoid will equal the slope of the tangent line to the graph. So the slopes of tangent lines represent instantaneous velocities.
On the graph below we see that the instantaneous velocity at t = a is greater than the average velocity between t = a and t = b, while the instantaneous velocity at t = b is less than this average velocity.