Calculus I Quiz 1014
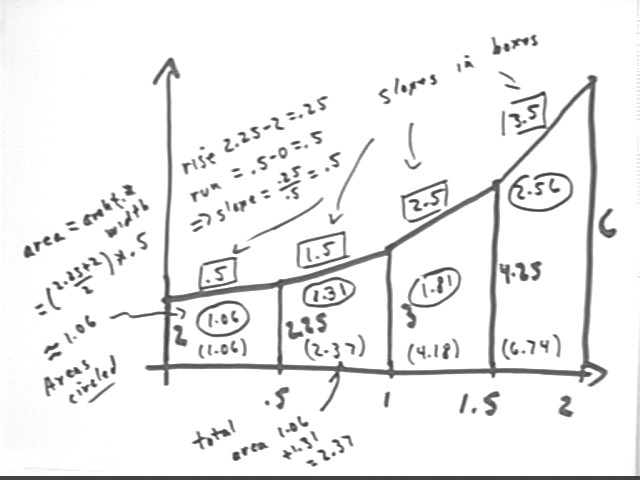
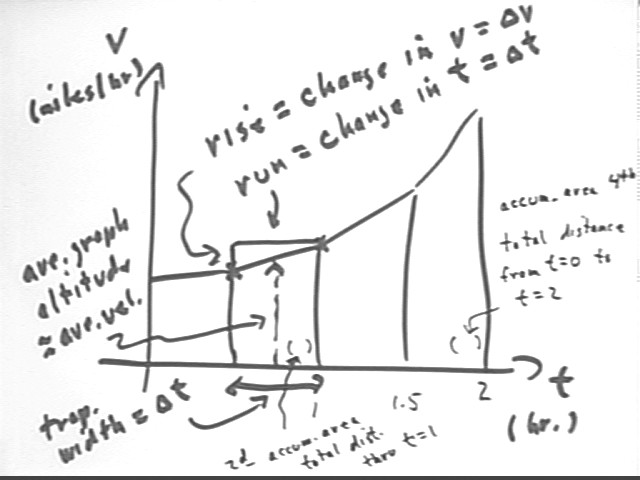
The graph below represents walking speed, in miles per hour, of a tired horse approaching the barn, vs. clock time in hours. What is the meaning of the slopes of the trapezoid? What is the meaning of the difference between the accumulated area of the second trapezoid and the accumulated area of the last?
Slope is rise / run which represents change in velocity / change in clock time, which is ave rate at which position changes, or average acceleration.
Technical note: Use of the term 'velocity' here depends on an implicit assumption that the horse is walking a straight line in one direction only, which is probably not the case. The actual quantity measured by slope is rate of change of speed with respect to clock time.
The area of a trapezoid is ave graph altitude * trapezoid width, representing average speed * change in clock time, which gives distance traveled. Accumulated area for this graph is the total distance traveled since t = 0. So the accumulated area of the second trapezoid is distance traveled up through t = 1 hour and the accumulated area of the fourth represents total distance traveled through t = 2 hours, so the difference between these accumulated areas represents distance traveled in the 1-hour interval between t = 1 hour and t = 2 hours.
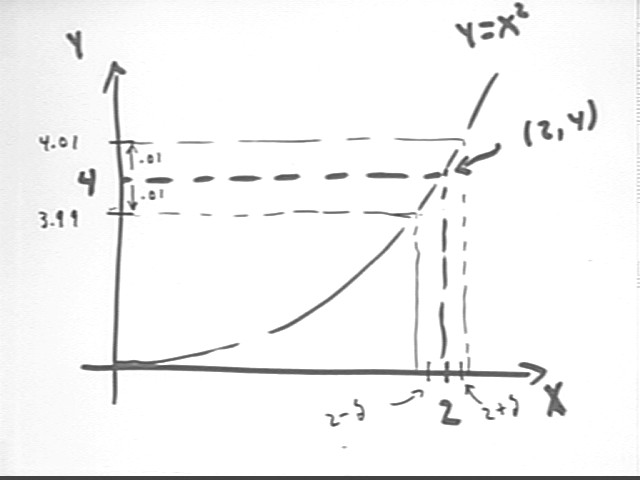
Determine the delta necessary to confine y = x^2 to within epsilon .01 of its x = 2 value.
We first see that the x = 2 point on the graph is (2, 2^2) = (2, 4).
We need, by confining x to within delta of 2, to confine y = x^2 to within .01 unit of 4, as indicated in the figure.
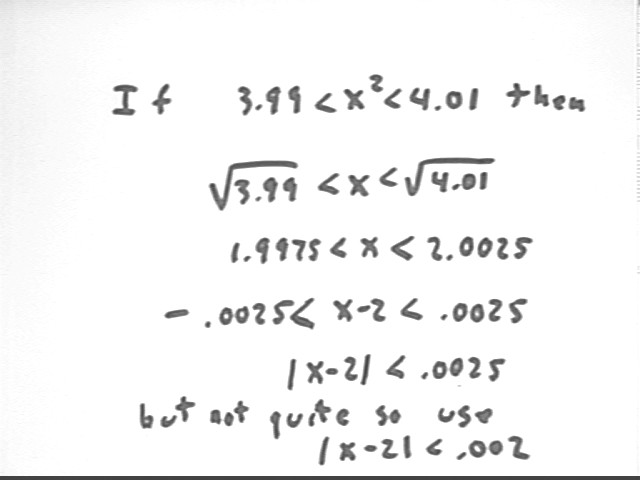
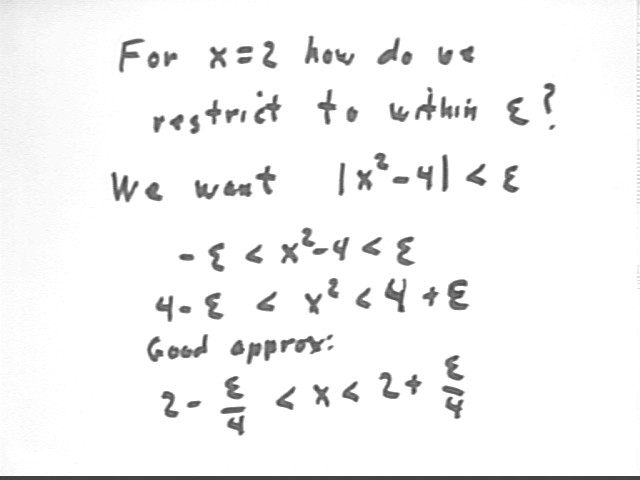
We can write the condition that | y - 4 | < .01 as | x^2 - 4 | < .01 or as -.01 < x^2 - 4 < .01.
We easily simplify this inequality to give us the approximate inequality 1.9975 < x < 2.0025, which would then give us -.0025 < x -2 < .0025. However we note that the approximation 2.0025 is slightly high, and that if we use .002 instead of .0025 we are comfortably within the required range and that | x - 2 | < .002 ensures that x^2 is within .01 of 4.
So we see that for epsilon = .01 at the x = 2 point we can choose delta = .002.
More generally we can restrict y = x^2 to within any desired epsilon at the x = 2 point. We with to find the delta correspond to arbitrary epsilon.
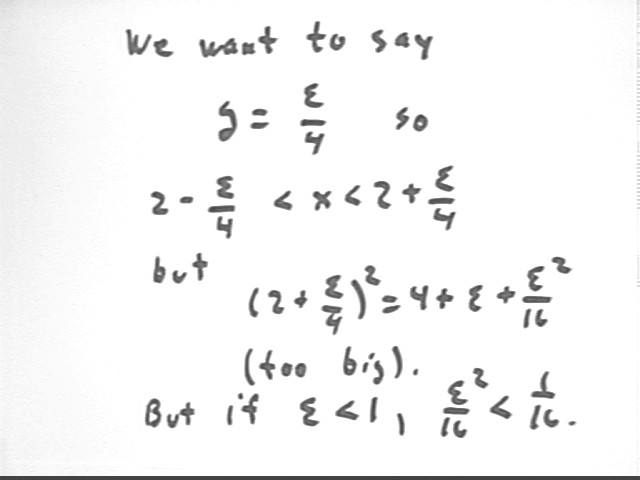
We quickly get the inequality 4 - epsilon < x^2 < 4 + epsilon. As seen in the third figure following, sqrt(1 +- mu) is very close to 1 +- mu/2 whenever mu is very small; we apply this to the expression sqrt(4 +- epsilon to get the approximate inequality 2 - epsilon / 4 < x < 2 + epsilon / 4.
However squaring this inequality doesn't quite confine y = x^2 to within epsilon of 4. There is that epsilon^2 / 16 term to worry about. We do note that if epsilon < 1, epsilon^2 / 16 < 1/16, but it turns out that this doesn't help a lot.
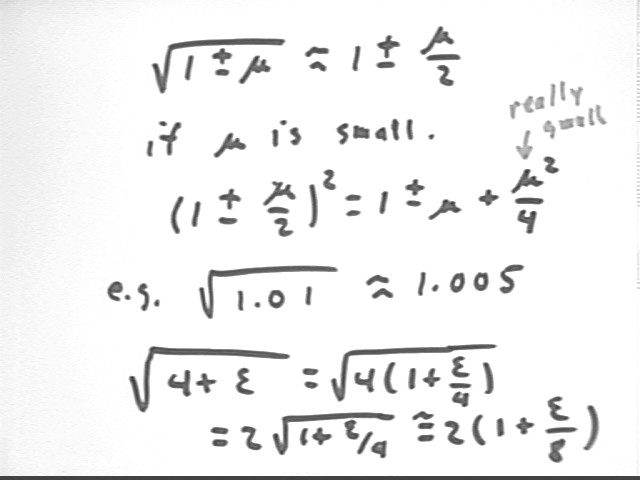
The details of the approximation sqrt(1 +- mu) = 1 +- mu/2 are shown below. The approximation is good to the extent that mu^2 is very small, which is it when mu is small.
Applying the idea to sqrt(1.01) = sqrt(1 + .01), for which mu = .01, we get the approximation sqrt(1.01) = 1.005. This approximation is very close, as you can check on your calculator.
Applying the idea to sqrt(4 + epsilon) we factor out sqrt(4) = get 2 sqrt(1 + epsilon/4). Using mu = epsilon/4 we get 2 sqrt(1 + epsilon / 8) = 2 + epsilon/4. Note that for epsilon = .01 we get epsilon/4 = .0025, consistent with results obtained in the first part of this problem.
It turns out that it is easier to figure out delta if we start with the inequality 2 - delta < x < 2 + delta. Squaring the inequality we get 4 - 4 delta + delta^2 < x^2 < 4 + 4 * delta + delta^2, which confines y = x^2 to within epsilon = 4 * delta + delta^2 of 4. So the desired delta will satisfy 4 * delta + delta^2 < epsilon.
Factoring delta out of the inequality 4 * delta + delta^2 < epsilon we get
delta * ( 4 + delta) < epsilon.
We can choose delta as small as we like. In particular we can restrict delta to values which are less than 1. If we specify delta < 1 then we know that 4 + delta < 5, so that delta * ( 4 + delta) < epsilon becomes
delta * 5 < epsilon, or
delta < epsilon/5.
Any time delta < epsilon/5, we therefore know that for x = 2, the value of y = x^2 is within epsilon of 4 whenever x is within delta of 2.
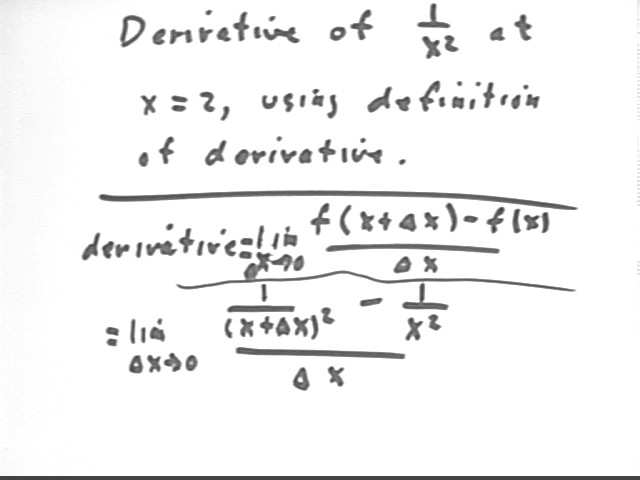
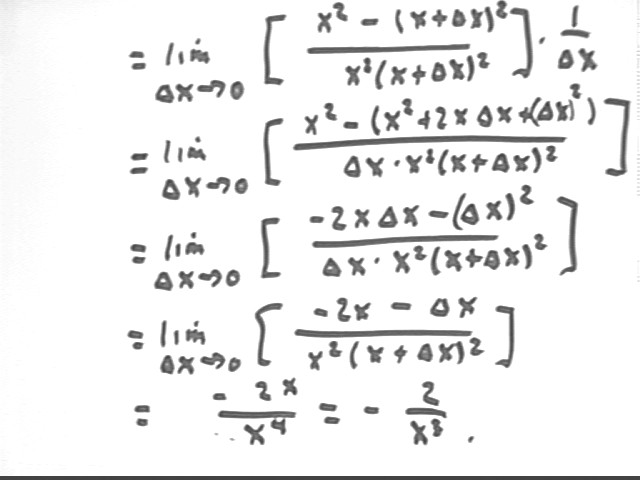
We find the derivative of f(x) = 1/x^2 at x = 2, using the definition of the derivative.
We first write the general expression for the derivative, which is lim {x -> 0 } ( [ f(x + `dx) - f(x) ] / `dx ).
For the function f(x) = 1 / x^2 this gives us the indicated expression.
We simplify the expression by writing the complex fraction as a product of simple fractions, and by simplifying the numerator of the complex fraction. The numerator is simplified by writing the two terms in terms of a common denominator, giving us the result in the first line below.
We then incorporate the `dx into the denominator of our expression and expand the numerator, as indicated in the second step.
In the third step we simplify the numerator of our fraction.
Note that in the first three steps our limit, which includes the factor `dx in every term, remains in 0 / 0 form so we cannot simply substitute `dx = 0 to find the limit.
In the fourth step we distribute the division by `dx through the numerator and obtain a form in which neither numerator nor denominator is 0 is we substitute `dx = 0. So for the fifth step we make this substitution, obtaining the indicated result.
It isn't shown below but we could now substitute x = 2 to get the value of the derivative at the x = 2 point as specified in the original problem.
However note that we have in this process derived the formula for the derivative function - 2 / x^3, which will give us the derivative of 1 / x^2 at any value of x.
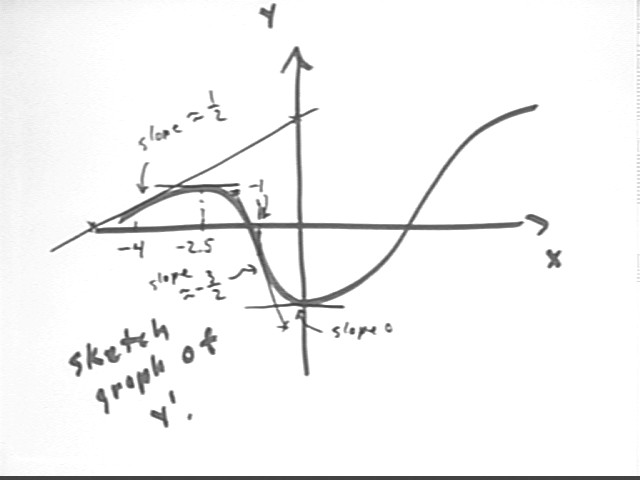
To plot the derivative function for the function indicated in the graph below, we plot the slope of the given graph vs. x. We see that the slope starts out positive, then decreases to 0 at the top of the first 'peak', then becomes negative before returning to 0 at the first 'valley', and then remains positive for the remainder of the interval depicted in the figure. So our graph of y ' vs. x will start positive, decrease to 0, then decrease through negative values before increasing again as it returns to 0, then remains positive.
More specifically if we are given a coordinate grid we can estimate slopes at various points using tangent lines. Our estimate of the slope at x = -4 is 1/2, and we estimate that the first 'peak' (where slope is zero) occurs around x = -2.5 and the first 'valley' (where the derivative is again 0) close to x = 0. Between these two zero-derivative points we have a point where the derivative reaches its steepest negative slope, which occurs near x = -1. At this point we estimate that the slope of the tangent line is about -3/2.
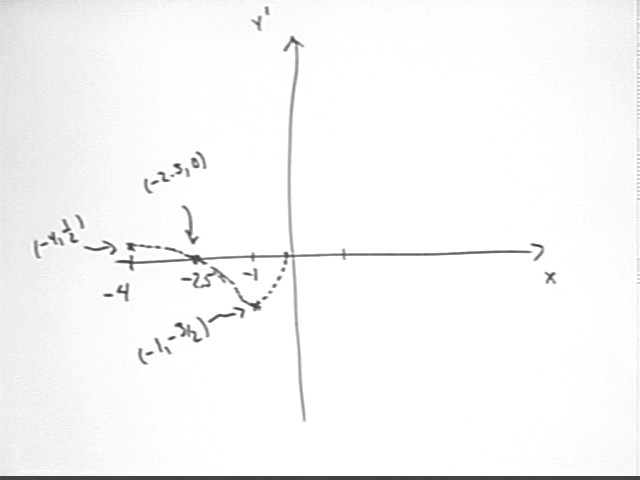
The graph of y ' vs. x indicates the estimates made from the graph of y vs. x. Only results up to about x = 0 are plotted here; you should attempt to construct the rest of the y ' graph.
Section 2.4 Problems 3, 6, 9, 12, 16, 19, 22, 27, 34, 37, 39
Section 2.5 Problems 3, 6, 10, 13, 16, 18, 21
Section 2.6 Problems 2, 4, 7, 9, 12, 13, 16, 17, 20, 22
Section 5.1 Problems 3, 5, 6, 8, 10, 11, 13