Calculus I Quiz 1016
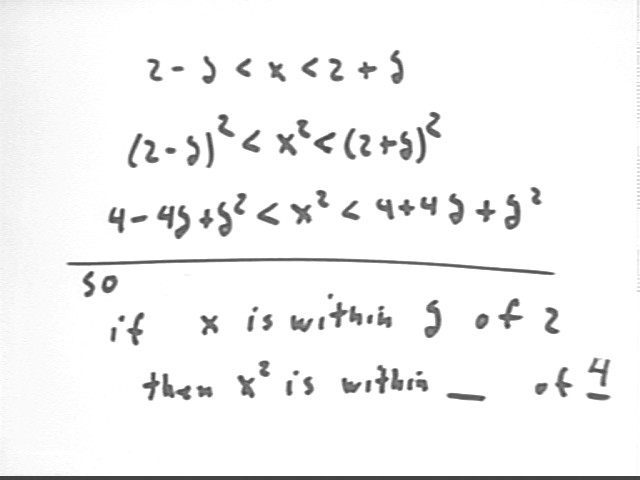
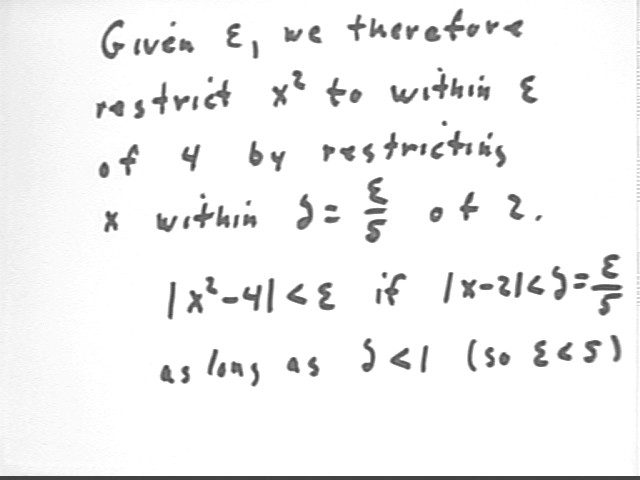
If 2-delta < x < 2+delta then what can we say about x^2?
Squaring each term of the given inequality and expanding the binomials tells us that
Since delta is presumable small this puts x^2 close to 4. How close have we 'squeezed' x^2 to 4 by 'squeezing' x within delta of 2?
We can sketch the figure below to help us determine that 4 - 4 delta + delta^2 lies within 4 delta - delta^2 units of 4 (just subtract the lower value from the upper), and that 4 + 4 delta + delta^2 lies within 4 delta + delta^2 units.
Since 4 delta + delta^2 is greater than 4 delta - delta^2 the best we can say is that y has been squeezed to within 4 delta + delta^2 units of 4.
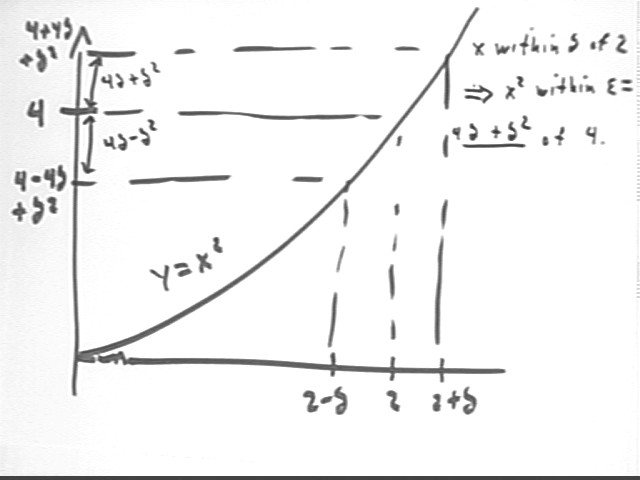
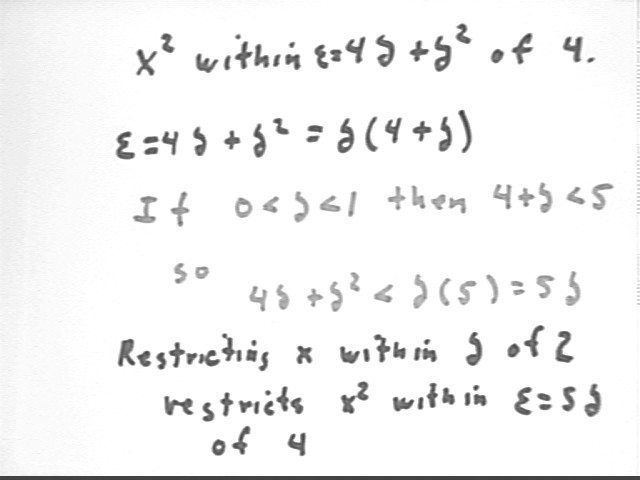
Thus when x lies within delta units of 2, x^2 lies within epsilon = 4 delta + delta^2 units of 4.
So if epsilon = 4 delta + delta^2 = delta ( 4 + delta), we can squeeze y within epsilon units of 4 by squeezing x within delta units of 2.
We need only find an expression for delta in terms of epsilon.
Noting that we lose nothing here by restricting delta to positive values which do not exceed 1, we see that
so that if we restrict x to within delta of 2 we restrict x^2 to within epsilon = 5 delta of 4.
We can turn this around to say that in order to restrict x^2 to within epsilon units of 4, we need only restrict x to within delta = epsilon / 5 units of 2.
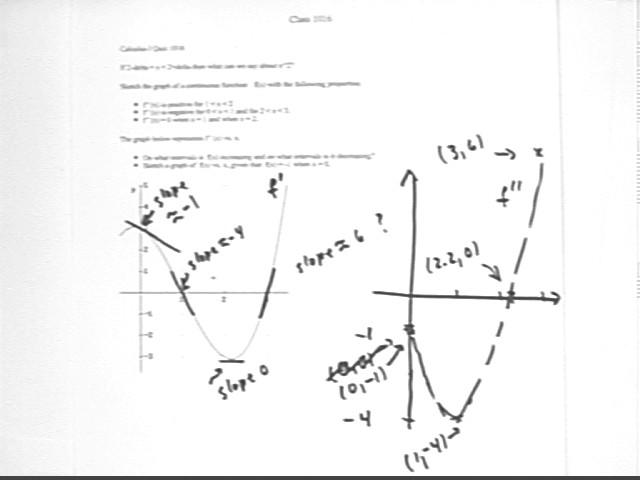
The graph below represents f ' (x) vs. x.
f ' (x) represents the rate of change of f(x), so the y values on the f ' (x) graph indicate the rates of change or slopes of the f(x) graph.
Thus f(x) will be increasing wherever f ' (x) is positive, and decreasing wherever f ' (x) is negative.
For x > 0 the values of f ' (x) are positive for 0 < x < 1 and for 3 < x.
The values of f ' (x) are negative for 1 < x < 3.
We conclude that f(x) must be increasing for 0 < x < 1 and decreasing for 3 < x.
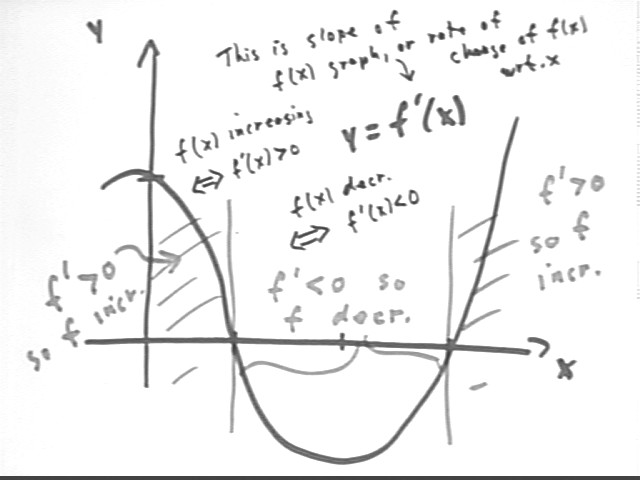
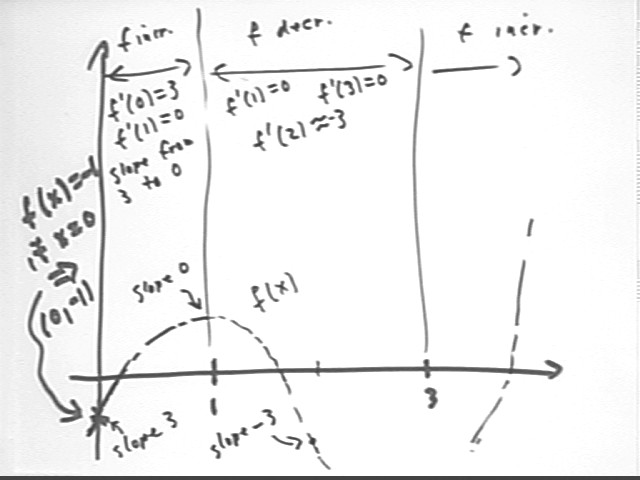
The graph shown below has these properties--it is increasing for 0 < x < 1 and for 3 < x, and decreasing for 1 < x < 3.
Other characteristics of this graph are determined as follows:
We are given that when x = 0, f(x) = -1. So our graph of f(x) will contain the point (0, -1).
At x = 0 the value of f ' (x) is 3, so the slope of the f(x) graph at the point (0, -1) must be 3, as indicated below.
At x = 1 the value of f ' (x) is 0, so the slope of the f(x) graph at the x = 1 point must be 0, as indicated below. The graph of f ' (x) is decreasing between x = 0 and x = 1 so the slope of our f(x) graph will be decreasing between x = 0 and x = 1, as is the case for the graph shown here.
At x = 1 and x = 3 the value of f ' (x) is 0, so the slope of the f(x) graph at the x = 1 and x = 3 points must be 0, as indicated below. About halfway between x = 1 and x = 3, near x = 2, f ' (x) reaches its lowest value, f ' (x) = -3. Thus, as indicated, at the x = 2 point the slope of the f(x) graph will be about -3.
It isn't completely shown in the figure but after reaching the slope of -3 the slope of the graph will gradually increase back to its value 0 at x = 3. This will occur at the low point of the f(x) graph.
Beyond x = 3 the graph of f ' (x) indicates increasing positive values, implying increasing positive slopes for the f(x) graph.
Note that though it wasn't requested we could construct a graph of the derivative of the f ' (x) function. This will give us the f ''(x) function.
The slopes of the f ' (x) graph will give us the values of f '' (x). We estimate these slopes at x = 0, x = 1, x = 2.2 (approx.) and x = 3, obtaining estimates of -1, -4, 0 and 6.
These estimates dictate the approximate points (0, -1), (1, -4), (2.2, 0) and (3, 6) on the f '' (x) graph.
Connecting these points with a smooth curve suggests a parabolic graph, as indicated below.
The actual function used for f(x) is f(x) = (x+1)(x-1)(x-3) = x^3 - 3 x^2 - x + 3.
We can easily take the derivative of this function, obtaining f ' (x) = 3 x^2 - 6 x - 1. This function is shown below.
Note the excellent agreement between the function as graphed and the estimate we obtained above.
What is f ' (x) = x^3 - 3�x^2 - x + 3 the derivative OF? The answer is the f(x) function.
To get x^3 we need to take the derivative of something times the fourth power. The derivative of x^4 is 4 x^3, so to get x^3 we take the derivative of 1/4 x^4.
Reasoning similarly with every terms we see that
f(x) = x^4 / 4 - x^3 - x^2/2 + 3 x + c
for some constant c.
Knowing that f(0) = -1 we have
f(0) = 0^4/4 - 0^3 - 0^2/2 + 3*0 + c = -1 so that
c = -1.
Thus f(x) = x^4 / 4 - x^3 - x^2/2 + 3 x - 1.
This function is graphed below. Note again the good agreement between this function and the estimated f(x) graph obtained above.

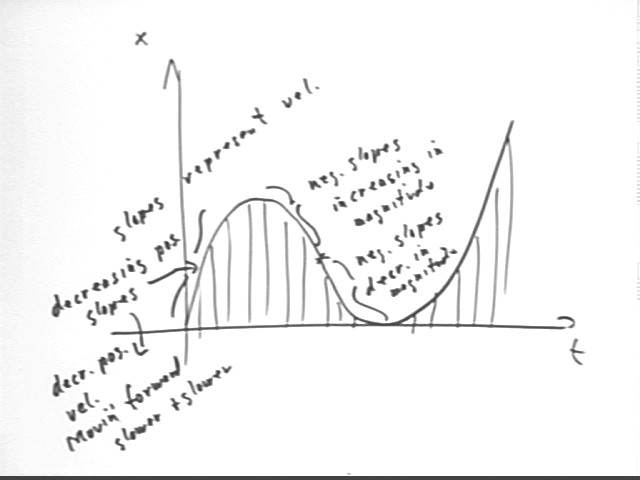
The graph below represents position vs. clock time.
Straightforward interpretation tells us that the slopes represent rates of change of position, i.e., velocities.
We see that the graph begins with a positive slope, and that slope gradually decreases to 0. This indicates decreasing positive velocity--an object which is moving forward but more and more slowly.
The slopes then become negative, indicating negative velocity. For a time steepness increases, indicating that the negative velocities increase in magnitude, which means that the velocities decrease to more and more negative values.
Then steepness begins to decrease, with slope gradually approaching zero; this indicates negative velocities increasing to 0. At the point where steepness begins to increase, velocity begins to increase. Note also that at this point the graph changes from concave down to concave up.
After the position vs. t graph levels off we see that velocities become positive and continue increasing.
What does the position vs. clock time graph pictured below tell us about velocity and acceleration? Assume that the positive direction is to the right.
We first note relevant characteristics of the graph:
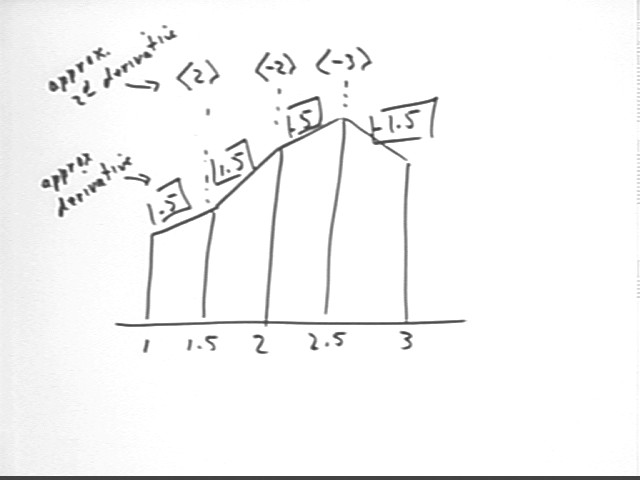
We can think of approximating this graph with trapezoids. The slope of each trapezoid will represent the velocity of the object. A positive slope represents motion in the positive direction (i.e., to the right) and a negative slope represents motion in the negative direction (i.e., to the left).
A complete trapezoidal approximation graph will include the rate at which slope changes, which is an approximation of the second derivative. The calculation and representation of the rate at which slope changes is illustrated in the figure below, on which for brevity only slopes and x values are given.
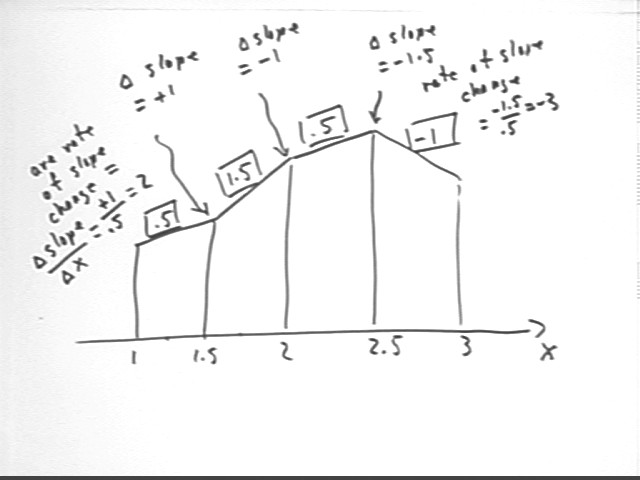
The rates of slope change are indicated above the corresponding x values by numbers in 'pointy braces'. In this case we indicate the rates 2, -2 and -3 as <2>, <-2> and <-3>.
Since slopes represent approximate derivatives, rates of slope change represent the derivatives of the approximate derivatives, or approximate second derivatives.