Calculus I Quiz 1030
Problem Number 1In terms of two simple examples involving depth, rate of depth change and time, explain the difference between the meaning of the slope of a trapezoid and the area of a trapezoid. Be sure to explain your results in terms of units and also in terms of meanings.
If y(t) is depth in cm when t is clock time in seconds then the graph altitudes of a y(t) vs. t trapezoid represent depths, and the rise of a trapezoid represents change in depth, in cm while the run represents change in clock time, in sec. Thus the slope represents change in depth / change in clock time, which is ave rate of change of depth, in cm / sec.
If y(t) is the rate of depth change, in cm/s, when t is clock time in sec then the graph altitudes of a y(t) vs. t trapezoid represent rates of depth change and trapezoid width represents change in clock time, so ave trap altitude * width represents ave rate of depth change * change in clock time = change in depth, in cm/s * s = cm.
In terms of two simple examples involving temperature, rate of temperature change and time, explain the difference between a situation where you obtain a meaningful result by subtracting two quantities and dividing by a time interval and a situation where you obtain a meaningful result by averaging two quantities and multiplying by a time interval. Be sure to explain your results in terms of units and also in terms of meanings.
If y(t) is temperature in degrees when t is clock time in hours then the graph altitudes of a y(t) vs. t trapezoid represent temperatures, and the rise of a trapezoid represents change in temperature, in degrees while the run represents change in clock time, in hours. Thus the slope represents change in temperature / change in clock time, which is ave rate of change of temperature, in degrees / hr.
If y(t) is the rate of temperature change, in deg / hr, when t is clock time in hours then the graph altitudes of a y(t) vs. t trapezoid represent rates of temperature change and trapezoid width represents change in clock time, so ave trap altitude * width represents ave rate of temperature change * change in clock time = change in temperature, in deg / hr * hr = deg..
Problem Number 2
If an ice cream cone 7 inches high contains 723.73 cal, then how many cal would we expect a geometrically similar ice cream cone 16 inches high to contain? Using the differential estimate the additional calories in a cone of height 7.05 inches as compared to a cone of height 7 inches.
We obtain our y = k x^3 proportionality.
The differential estimate is y ' * `dx, representing rate of change of y with respect to x multiplied by change in x, which for small `dx gives us good approximation to the change in y.
Note that y ' = 3 k x^2, and you shoulda found k to start with.
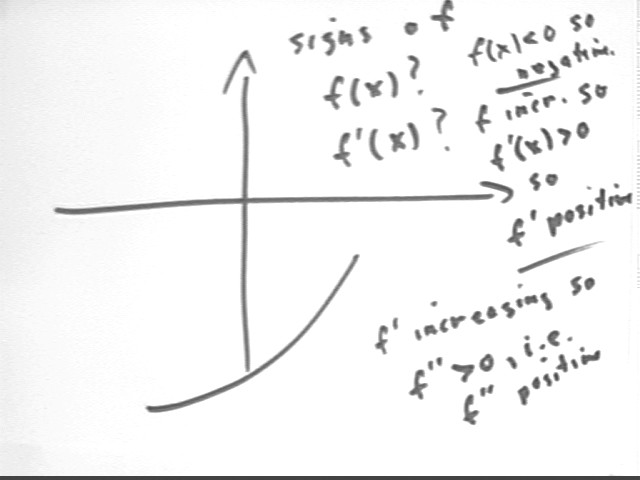
Problem Number 3What are the signs of f(x) and f ' (x) if the function f is negative and increasing at an increasing rate? Sketch possible graphs of f(x) and f ' (x).
Problem Number 4
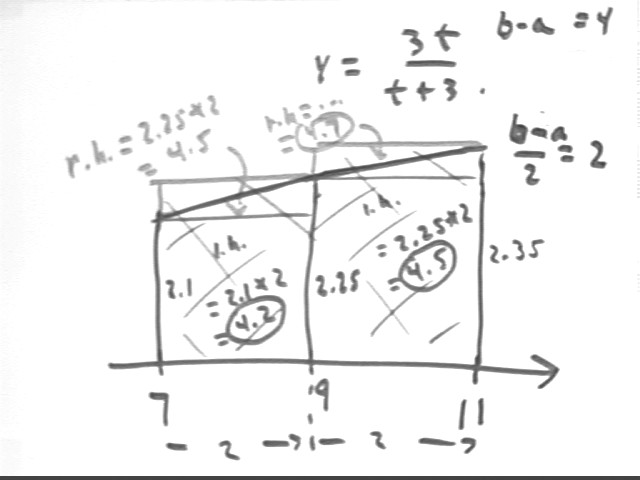
Use both 2-interval and a 5-interval approximations to find the left and right Riemann sums of the function y = 3 t / ( t + 3) from t = 7 to t = 11.
The 2-interval approximations are obtained by first constructing a graph from t = 7 to t = 11. We find the interval `dt = (b - a) / n = (11 - 7) / 2 = 2 and locate the intermediate point a + `dt = 7 + 2 = 9 on the graph. We then plug in the t values 7, 9 and 11, obtaining graph altitudes y, which we label.
Using left-hand graph altitudes to get the left Riemann sum and right-hand graph altitudes to get the right Riemann sum we get l.h. = 4.2 + 4.5 = 8.7 and r.h. = 4.5 + 4.7 = 9.2.
Note
that difference is r.h. sum - l.h. sum = 9.2 - 8.7 = .5, which is [ y(11) - y(7) ] * `dt = (2.35 -
2.1) * 2 = .5.
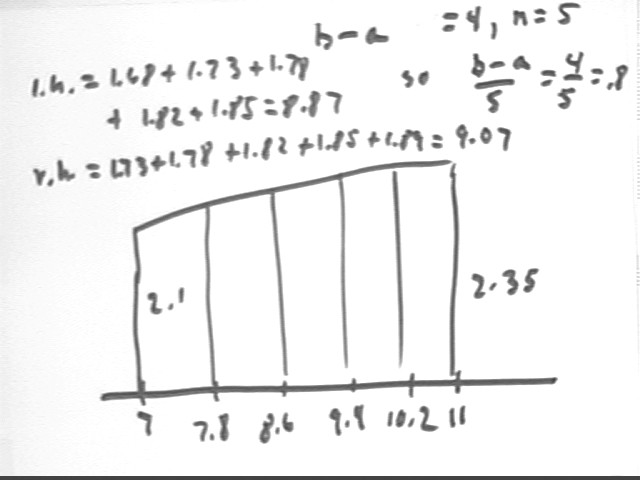
The 5-interval approximation uses `dt = (11 - 7) / 5 = .8, giving us intermediate points 7.8, 8.6, etc..
The sums are l.h. = 8.87 and r.h. = 9.07. Results are calculated in the table immediately beneath the figure.
Note that difference is 9.07 -
8.87 = .2, which is [ y(11) - y(7) ] * `dt = (2.35 - 2.1) * .8 = .2.
| t | y | lh | rh |
| 7 | 2.1 | 1.68 | |
| 7.8 | 2.17 | 1.73 | 1.73 |
| 8.6 | 2.22 | 1.78 | 1.78 |
| 9.4 | 2.27 | 1.82 | 1.82 |
| 10.2 | 2.32 | 1.85 | 1.85 |
| 11 | 2.36 | 1.89 | |
| 8.87 | 9.07 |
Best estimate averages the lower and upper sum.
(9.2 + 8.7) / 2 = 8.95.
For the 5-interval approx. we get
(9.07 + 8.87) / 2 = 8.97.
The average of the l.h. and r.h. sums is in fact the trapezoidal approximation, as you should verify.
We note that because of the downward concavity of the graph (i.e., the decreasing slope) our linear approximations will lie beneath the curve and our trapezoidal estimates of areas will therefore be underestimates. Our 5-interval approximation should be closer to the actual value than our 2-interval approximation, so that the 5-interval approximation should be a little greater than the 2-interval approximation. We see that this is indeed the case.
What would be the difference between left- and right-hand sums if we used 100 intervals for the approximation?
For 100 intervals we would have `dt = (11-7)/100 = .04 so the difference would be
[ y(11) - y(7) ] * `dt = (2.35 - 2.1) * .04 = .01.
Problem Number 5Draw the graph of a continuous function f(x) satisfying all the following conditions:
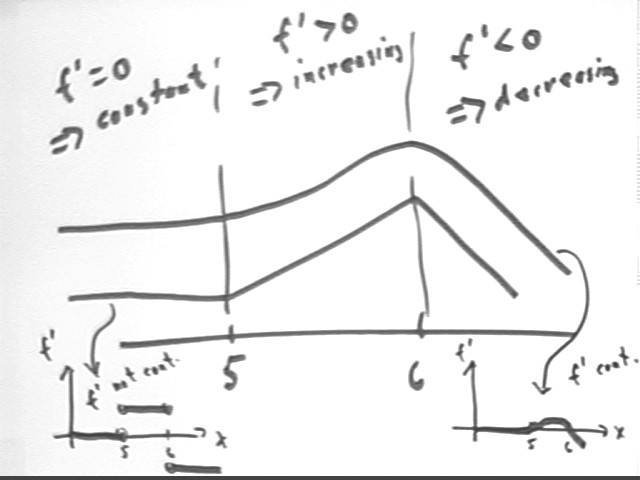
From the given information we see that f is decreasing for x > 6, increasing on the interval 5 < x < 6 and constant for x < 5.
We can sketch at least two possible f(x) functions with these characteristics.
The 'upper' curve is smooth, with a continuously changing slope. This will lead to the f ' vs. x graph indicated at lower right, where f ' remains zerp up to x = 5 then increases for a time before decreasing back through f ' = 0 at x = 6. This f ' function is continuous.
The 'lower' curve is linear on each interval, being level for x < 5, then increasing at a constant rate between x = 5 and x = 6, then decreasing at a constant rate for x > 6. The derivative changes abruptly from 0 to some constant positive value at x = 5, then at x = 6 again changes abruptly to some negative value. This f ' vs. x function is not continuous.
Explain in terms of rates and amounts why and how, given the values of a derivative function y ' (t) at two nearby t values, we can estimate the change in its antiderivative y(t) between these t values by averaging two values of y ' (t) and multiplying by the corresponding time interval.
y ' (t) represents the rate at which the y(t) function is changing. If we average the y ' (t) values at two nearby t values we expect to have a good estimate of the average value of y ' (t) over that interval, i.e., a good estimate of the average rate at which y is changing with respect to t over the given interval.
Multiplying the ave rate of change of y with respect to t by `dt gives us the change in y: `dy = y' Ave * `dt. Since we have a good approximation to y ' Ave we expect that we get a good approximation to the change `dy in y.
Problem Number 7Problem: Derive the expression for the instantaneous rate of change of the function y(t) = a t3 at clock time t.
This means simplify the expression for [ y(t + `dt) - y(t) ] / `dt and take the limit as `dt -> 0.
Problem: If the rate of depth change is rate(t) = .024 t + -1.2, then what is the depth function if the depth at clock time t = 0 is 64? At what instant is the depth equal to 42.362, and what is the instantaneous rate of depth change at that instant?
Depth fn is an antiderivative; in general we'll get .012 t^2 - 1.2 t + c.
If depth at t = 0 is 64 we get
y(0) = .012 * 0^2 - 1.2 * 0 + c = 64 so
c = 64 and
y(t) = .012 t^2 - 1.2 t + 64.
Depth is 42.362 when .012 t^2 - 1.2 t + 64 = 42.362. We solve for t using the quadratic formula, after rearranging into appropriate form.
To get instantaneous rate of depth change plug the solution for t into the given rate function.
Text Section 3.1
Section 3.1, Problems 1-15, 17, 18, 22, 26, 27, 29, 31, 36-41, 43, 45, 48, 51, 54, 57, 58, 60
Text Section 3.2
Section 3.2, Problems 1, 3, 6, 9, 12, 14, 16, 19, 22, 23, 26, 28-32, 34, 35, 37, 40, 42, 45
The derivative of the product of a constant number and a function is equal to the constant times the derivative of the function. i.e., a constant 'factors out' in the process of finding a derivative. We have implicitly used this in taking derivatives of polynomials. For example, we know that the derivative of .015 t^2 = .015 ( 2 t) = .03. This is an application of the 'constant-product rule'.
This rule is easily proved using the definition of the derivative. Applying the definition to the function [ c * f(x) ] we get the following:
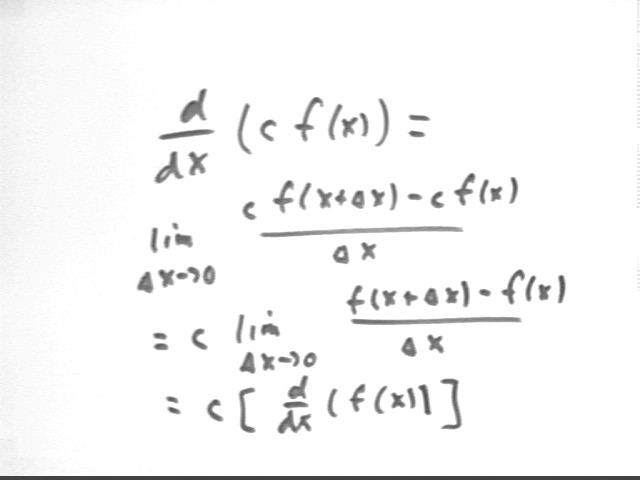
We see that we end up being able to factor the c out of the numerator, and hence out of the entire limit. This proves that wat we've been doing all along is always justified.
We can just as easily prove that the derivative of the sum of two functions is the sum of the derivative--that [ f(x) + g(x) ] ' = f ' (x) + g ' (x).
Using the formula for the binomial expansion we can extend the proof of the rules we've derived for the derivatives of x^2, x^3 and x^4 to any integer power, so that [ x^n ] ' = n x^(n-1).
Using other methods this can be extended to negative values of n, so that for example [ x^-3 ] ' = -3 x^-4, and to fractional n so that, for example, (sqrt(x)) ' = ( x^.5) ' = .5 x^-.5.