"
Calculus I
Finding Slopes for a Quadratic Model
We can find the average rate
of depth change between any two clock times, given a depth vs. clock time function. We
evaluate the function at the two clock times to determine the depths corresponding to
these clock times, then we calculate the change in depth and the difference in the clock
times `dy / `dt. We use these differences to calculate the average rate.
For a specific quadratic
function we can symbolically calculate the average rate between clock times t and t + `dt;
imagining that `dt approaches zero we obtain the actual rate-above-change function dy /
dt, or y'(t).
Average
Rates of Change for the Depth vs. Clock Time Model
During the last class session we found the depth
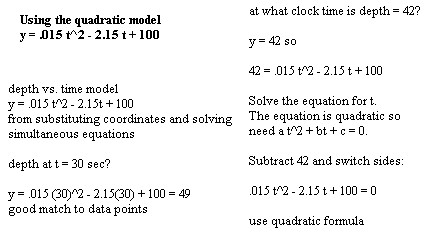
vs. time model y = .025 t^2 - 2.15 t + 100.
- Recall that we can use this model to find
the depth at any given time.
- For example to find the depth time t = 30 seconds we
substitute the number 30 for the variable t, obtaining y = 49 cm.
- We note that this is in excellent agreement with our
original data.
- We can also use the model to find the clock
time at which a given depth occurs.
- For example to find the clock time
when the depth is 42, we set the value of y equal to 42 and obtain a quadratic equation
which we can easily solve for the variable t to find the desired clock time.

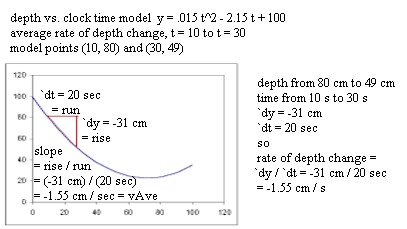
We now wish to find the average rate at
which the depth changes between clock times t = 10 sec and t = 30 sec, according to our
model.
- We first substitute the clock time t = 10 into our
model, obtaining depth y = 80 cm and giving us the graph point (10, 80).
- Similarly for clock time t = 30 we obtain depth y =
49 cm and graph point (30, 49).
- Between the graph points we obtain the time interval
of 30 s - 10 s = 20 seconds and a depth change of 49 cm - 80 cm = -31 cm.
- The average rate of depth changes then seen to be
-31 cm / 20 sec = -1.55 cm/sec.
This average rate of depth change
corresponds precisely to the slope of the graph between the two graph points.
- The 20 second time interval
corresponds to the run of the graph between the two points and the -31 cm depth change
corresponds to the rise of the graph between those points.
- The rise divided by the run, or the
slope, therefore corresponds to the depth change divided by the time interval, and hence
to the average speed of the water surface.

Precise Rate of Depth
Change for the Model
Suppose now that we want to find the
precise velocity of the water surface at the exact instant when clock time t is 10
seconds.
- We could use the previous procedure to find the
average slope between the t = 10 and the t = 12 clock times.
- We would obtain the result
- average rate = slope = -1.82 cm /
sec.
- Over such a short time interval, where the velocity
doesn't change by much, we might expect that this average rate is very close to the
precise rate at clock time t = 10.
- However, because of the small but finite variation
in velocity, this average rate isn't completely precise.
We could even shrink the interval as much as we
desire, say from t = 10 seconds to t = 10.0001 seconds.
- There certainly isn't much variation in the velocity
of a water surface, or in the slope of the graph, between these clock times.
- However there is a very tiny but finite variation,
and we still won't have a completely accurate value for the precise rate at clock time t =
10 sec.
Instead of shrinking the time interval by specific
amounts, we can let `dt stand for the length of the time interval, and use symbols
to arrive at a general expression for the average rate.
- We can then see what happens when `dt shrinks to
zero, with the expectation that the result will indeed be the precise rate we desire.
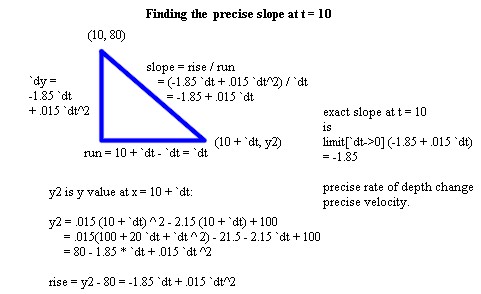
The clock time over the interval will go from t =
10 to t = 10 + `dt.
- This situation is depicted on the graph below.
- We use y2 to stand for the y coordinate at clock
time t = 10 + `dt.
- In order to arrive at the expression we desire, we
need to express the coordinate y2 in terms of the other quantities specified for this
problem.
- Since the coordinate y2 corresponds to the clock
time 10 + `dt, we can obtain y2 by substituting 10 + `dt into our quadratic model.
- We obtain y2 = .015 (10 + `dt)^2 - 2.15(10 + `dt) +
100, which with some care we simplify to obtain the expression y2 = 80 - 1.85 `dt + .015
`dt^2.
We can now determine the rise and the run between
the two clock times.
- The rise is the difference between y2 - 80 = -1.85
`dt + .015 `dt^2 (note how the 80's cancel) and the run is the time interval `dt.
The slope is therefore
- rise/run = (-1.85 `dt + .015 `dt^2)
/ `dt = -1.85 + .015 `dt.
(Note that in the above example,
using clock times 10 and 12, `dt was 2. We obtained an average slope of -1.82. If we
substitute `dt = 2 into our just-derived expression for the slope we obtain slope = -1.82,
which is in perfect agreement with our previous result.)

Further questions:
- Using the above model, determine the symbolic
expression for the average slope between clock time t and clock time t + `dt.
- Using the model y = a t^2 + b t + c, determine the
symbolic expression for the average slope between clock time t and clock time t + `dt.
"
