"
Class Notes Calculus I
Project #3; Derivative of y = a x3; The Differential
We work a review problem involving a quadratic depth function.
Testing the proportionality y = a x^3 for sandpile volume y vs. diameter x,
we obtain questionable results. Looking at the proportionality for different
sandpiles, and comparing with a DERIVE best fit for y vs. x data, we conclude that for the
data considered y = .002 x^3 is a good, if not perfect, model.
Using the definition of the derivative we do a little algebra and determine
that the derivative of y = a x^3 is y ' = 3 a x^2.
For a given diameter x we easily determine the rate y' = dy / dx= 3 a x^2 at which the
volume y of a sandpile is changing, with respect to changes in x, at that diameter. Using
this rate we can estimate the volume change for a given small change `dx in x. The volume
change will simply be the product of the rate y' and change `dx in x: `dy = y' * `dx, or
`dy = dy / dx * `dx.
The essence of the concept of the differential is that the change `dy in y
corresponding to a change `dx in x is `dy = y'(x) * `dx.
Depth Function and
Rate of Depth Change Function
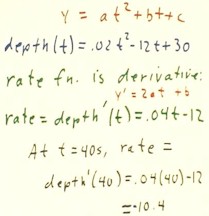
Given depth function depth(t) = .02 t2 - 12 t + 30, we wish to find
the instantaneous rate which depth is changing at clock time t = 40.
We first find the rate of depth change function.
- The depth function is of the form y = depth(t) = a t2 + b
t + c, a quadratic, so that the rate of depth change function is the
derivative depth ' (t) = .04 t - 12 (obtained from our previous knowledge
that the derivative of the quadratic is y' = 2 a t + b).
This rate of depth change function can be evaluated at clock time t = 40, and
we obtain depth ' (40) = -10.4, as indicated in the figure below.
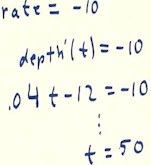
In order to find the instant at which the rate of depth change is -10, we set
the rate of depth change function equal to 10, obtaining the equation depth '
(t) = .04 t - 12 = -10.
- This equation is
easily solved for t. We obtain clock time t = 50.
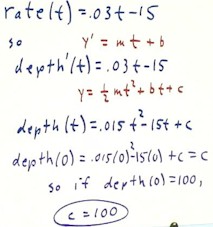
Given the rate function rate(t) = .03 t - 15, what is the
corresponding the depth function, provided that depth at clock time t = 0 is
100?
- The rate is the derivative rat(t) = depth ' (t), so we have depth ' (t) =
.03 t - 15.
- This is of the form y' = mt + b which, as we have seen, is the derivative
of the function y = .5 m t2 + b t + c.
- Since m = .03 and b = -15, we see that
y = .5 m t2 + b t + c = .015 t2 - 15 t + c.
- If we know that the depth at clock time t = 0 is 100, then depth (0) =
.015 (0)2
- 15 (0) + c = c.
- We also know that depth (0) = 100, so c = 100.
- Our depth function is therefore depth (t) = .015 t2 -
15 t + 100.
video clip 01
http://youtu.be/34QFdK1SvdE
video clip 02
http://youtu.be/xmlliysFQnE
Analyzing
volume vs. diameter data for sandpiles
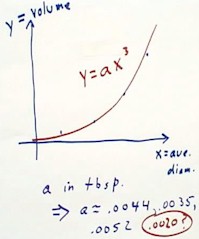
The graph below shows a typical set of data points (blue points) on a volume
vs. average diameter graph. We hypothesize that the function y = a x^3, for an
appropriate value of a, will provide a good model of this data.
- Volume is measured
in tablespoons and average diameter in the units of the circular graph on
which diameters were measured.
- Reported values of
a, obtained by averaging values implied by different points, were in the
range .0035 to .0052 when volumes were measured in units of tablespoons.
- For any point, if
y = a x^3 we have a = y / x^3; we merely calculate a = y / x^3 for each
point and check for consistency.
- If a values are
reasonably consistent, we confirm the y = a x^3 proportionality; otherwise
we suspect that there might be another proportionality at work here.
- A DERIVE best fit
using fit([x,ax^3], ###), should yield a consistent value of a.
- A DERIVE best fit to
the data of one individual gave y = .0020 x3, implying
approximately half of the reported value for a. This discrepancy remains
unexplained, but the procedures described in the instructions for the
project should be compared with a procedure followed below.
video clip 03
http://youtu.be/Xrh9dT9kUSE
One of the reported data points was volume y = 4 tablespoons when the
diameter was 12.6 units.
- Substituting these
values into the proportionality y = a x3, we obtain a = .002, as
shown below.
- This is in agreement
with the DERIVE best fit, which was seen to provide excellent agreement with
the data.
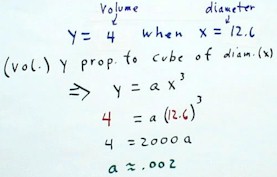
We conclude that the model y = .002 x^3 seems to work fairly well for
sandpile volume y vs. diameter x.
video clip 04
http://youtu.be/c_W54Vn6Kzc
The derivative of y = a x3
We proceed to find the derivative of the function y = a x3.
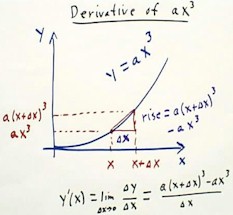
- The graph below depicts this function.
- In order to find the derivative of the function at the point x, we follow
the usual procedure:
- We evaluate the function at x and at x + `dx, then
- we determine the change `dy in y values corresponding to the change `dx
at x.
- We then take the limit of this expression as `dx -> 0.
As shown on the graph the y values are y(x) = a x3 and y(x + `dx)
= a (x + `dx)3.
- The rise of the slope triangle is therefore rise = `dy = a(x+`dx)3
- a x3, and the run is of course `dx.
- So to find y'(x) we will take the limit of the expression [a(x + `dx)3
- a x3] / `dx.
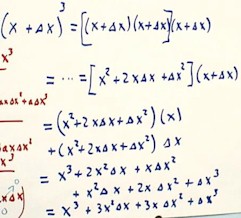
In order to compute the desired limit we first expand the expression (x +
`dx)3.
- This is done by repeated application of the distributive law.
- We could also have used the binomial theorem, which will use later when we
calculate the general derivative of the function y = a xn.
- The details of the calculation are shown below.
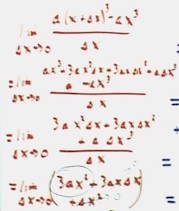
We now calculate the desired limit.
- We note that the a x3 term cancels out in the third step,
leaving only terms with `dx, `dx2 or `dx3 in the
numerator.
- This is a good thing, because we're dividing by `dx, which approaches 0 so
it had better cancel out with everything in the numerator.
- It does, leaving us with the expression 3 a x2 + 3 a x `dx +
`dx2.
- The limit of this expression as `dx approaches 0 is clearly 3 a x2.
- This is our desired limit and the derivative of the function y = a x3.
Thus d (a x3) / dx = 3 x2.
video clip 05
http://youtu.be/sPtdq1DH6Rk
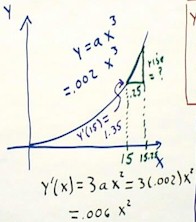
We apply the derivative to the following situation:
If our specific model of sandpile amount vs. diameter is y = a x3
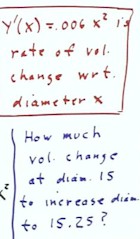
= .002 x3, then how much additional sand would we have to add to a
pile whose diameter is 15, in order to raise the diameter by .25 units, to
15.25?
- We could of course figure out the answer by substituting 15 and then 15.25
into the volume function y = .002 x3.
- However, it is often expedient to use knowledge of the derivative to
estimate such a difference.
- Estimation is sometimes more efficient and the results provide greater
insight into the way volume builds.
- The 'green' triangle on the graph depicts the rise corresponding to the
'run' of .25 from 15 to 15.25. The horizontal distance and, consequently,
the vertical distance are greatly exaggerated for clarity.
- Observe that if we knew the slope of the green triangle, then since we
know the run we could easily find the rise (rise = run * slope).
- We note that the derivative at x = 15 is the limiting value of the slopes
of the triangles starting from the x = 15 point on the graph, as the run
approaches 0.
- The run of the present graph, .25, is pretty small on the scale of the
graph, so we expect that the slope of the green triangle is pretty close to
the value of the derivative. So we use this derivative as the
approximate slope to find the rise.
- The derivative y' = 3 a x2 is, for this function, y' = .006 x2.
video clip 06
http://youtu.be/2jEokcXh-pc
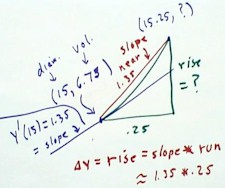
The figure below is a closer look at the green triangle of the former graph.
- The lower left hand corner of the slope triangle is a point (15,6.75),
representing the diameter x = 15 and the resulting volume, obtained by
substituting the diameter into the formula y = volume = .002 x3.
- Note that as mentioned before we could find the volume change easily
enough by substituting 15.25 into the same formula and subtracting the
results to get the rise of the triangle.
At x = 15 the derivative of the function is y' = .006 x2 = .006
(152) = 1.35.
- This is the rate at which the function is changing at x = 15.
- To remind ourselves of the meaning of this rate, we note that since x is
measured in diameter units and y in tablespoons (tbsp), the rate is 1.35
tbsp / diam unit.
- If volume continues changing at this rate, then as x changes by .25 units
of diameter the volume must change by
- volume change = 1.35 tbsp / diam unit * (.25 diam units) = .35 tbsp.
- Of course the volume doesn't continue changing at precisely this rate, but
if the rate doesn't vary too much our estimate will still be good.
The figure shows the graphical representation of our reasoning.
- The tangent line to the point (15, 6.75), with its slope y ' (15) = 1.35,
is sketched in purple.
Since there is an upward curvature to the graph, with a resulting steady
increase in the slope, the actual slope between the x = 15 and the x equal 15.25
points of the graph will be slightly greater than the 1.35 slope of the tangent
line.
- The curvature of the graph and the resulting discrepancy between the slope
of the tangent line and that of the slope triangle have been deliberately
exaggerated in this figure; over the distance .25 between the x values for
this function in this region, the graph would be very nearly straight and
the difference between the two slopes would be very slight.
Assuming that the slopes are in fact nearly the same, so that the slope of
the slope triangle is near 1.35, we can easily calculate the difference in the y
values between the two points.
- This difference will be the rise of the triangle.
- If the run is .25, then the rise will be `dy = rise = slope * run = 1.35 *
.25 = .35.
- This rise corresponds to the .35 tbsp increase we found above.
video clip 07
http://youtu.be/r74Cbq9gMgs
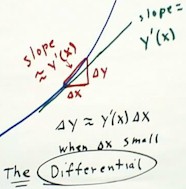
We see that in general at a graph point (x,y) of a function y(x) the slope is
y'(x) and that, for small `dy corresponding to the change in x coordinate from x
to x + `dx will be very close to `dy = y ' (x) * `dx.
This is the essence of the concept of the differential. This is a very
important concept that often eludes first-year calculus students. Hopefully this
common-sense first exposure to the idea will make things clearer when a rigorous
study of the differential is undertaken.
video clip 08
http://youtu.be/N1gD3SnzKV8
"
