Calculus II Class 02/19
\During the recent rain I used 2 identical buckets to obtain an estimate of the rainfall. I dumped one into the other which filled it to a depth of 6 inches.
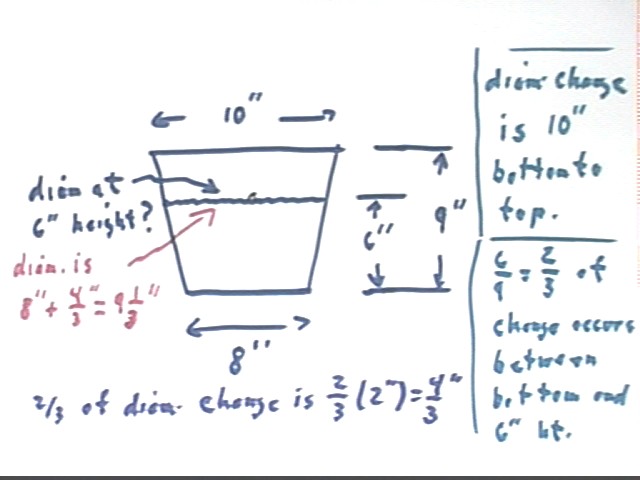
Bucket dimensions: total height 9 inches, diameter of base 8 inches, diameter of top 10 inches.
How many inches of rain fell into the initially empty buckets?
What can we figure out about this situation?
Answers given: We can easily find the c.s. areas of base and top.
We can find the diameter at the 6-inch height, at which point 2/3 of the diameter change from bottom to top will have taken place.
So what is the diameter at this point?
Change in diameter from bottom to top is 2 inches. 2/3 of this change takes place between bottom and 6-inch height.
2/3 * 2 inches = 4/3 inch.
So diameter at 6-inch height is 8 inches + 4/3 inch = 9 1/3 inch = 28/3 inch, approx. 9.33 inches.
The figure below summarizes this calculation. On starting the problem you should have sketched a picture equivalent to this one.
Now construct a trapezoidal graph of diameter vs. height for height = 0 to height = 6 inches, using increment 2 inches.
Diameter change from bottom to 2 inch height is 2/9 of diameter change, or 2/9 * 2 inches = 4/9 inch. Diameter at 2 inch height is therefore 8 inches + 4/9 inch = 8 4/9 inch, approximately 8.44 inches.
Each 2 inch increment adds 4/9 inch, so diameters are as follows:
| height (in) | diameter (in) |
| 0 | 8 |
| 2 | 8 4/9 = 8.44 |
| 4 | 8 8/9 = 8.89 |
| 6 | 9 3/1 = 9.33 |
The corresponding trapezoidal graph is depicted below.
An alternative means of constructing the graph is to note that since the sides of the bucket's profile form straight lines, the diameter is a linear function of height. Since diameter = 8 inches when height = 0 the y-intercept of the graph is (0, 8), and since the graph connects the points (0, 8) and (9, 10) its slope is rise - run = 2/9. The equation of the line is therefore y = m x + b or y = 2/9 x + 8, where x = height and y = diameter.
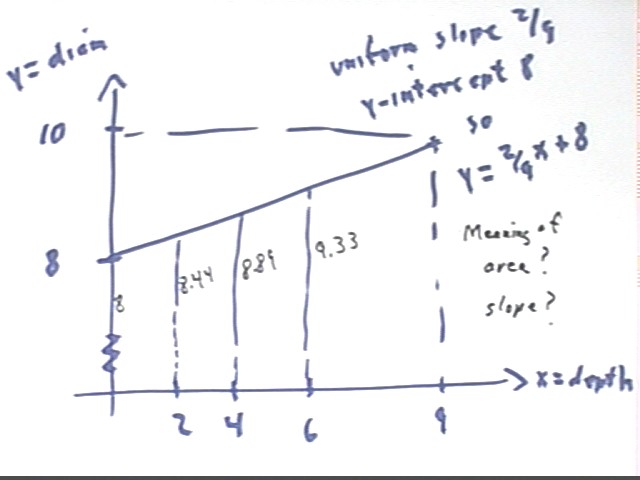
The slopes of this graph represent change in diameter / change in height, or rate of change of diameter with respect to height. The slope of the graph is a constant 2/9, representing 2/9 of an inch of diameter change per inch of height change. This comes from the geometry of the bucket.
The areas of the graph represent average diameter * change in height, which doesn't tell us much about volume.
Construct a trapezoidal graph of c.s. area vs. height.
The cross sections are obviously circular, and the cross sectional area is easily calculated as pi r^2.
For example for depth 2 in the diameter is 8.44... in so the radius is 4.22... in. The c.s. area is therefore A = pi r^2 = 3.14 * (4.22 in)^2 = 50.3 in^2, approx.
|
depth (in) |
diameter (in) |
cs area (in^2) |
|
0 |
8 |
50.3 |
|
2 |
8.44 |
56.0 |
|
4 |
8.89 |
62.1 |
|
6 |
9.33 |
68.4 |
The corresponding trapezoidal approximation graph is depicted below.
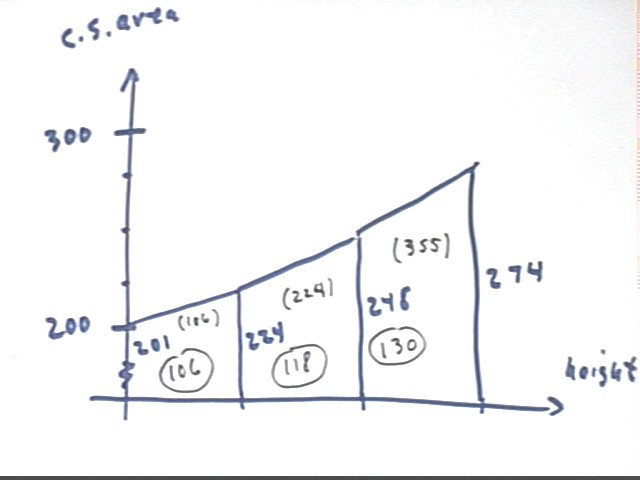
The altitudes of a trapezoid represent cross-sectional areas at the 'bottom' and the 'top' of the corresponding slice of the bucket in in^2, so average altitude is a good approximation of the average c.s. area of a slice in in^2. The width of a trapezoid represents the thickness in inches of the slice, so area of a trapezoid represents the volume of a slice.
The volumes of the three 2-inch slices comprising the 6 inches of water in the bucket are as indicated in the table below. The total graph area represents a volume of about 355 in^3.
|
depth(in) |
diameter (in) |
cs area (in^2) |
graph area (in^3) |
|
0 |
8 |
50.3 |
|
|
2 |
8.44 |
56.0 |
106 |
|
4 |
8.89 |
62.1 |
118 |
|
6 |
9.33 |
68.4 |
130 |
|
355 |
From these approximations it is clear that the volume of the water in the bucket is the area beneath the curve representing c.s. area vs. depth.
Diameter is represented, as we saw above, by the expression (8 + 2/9 x).
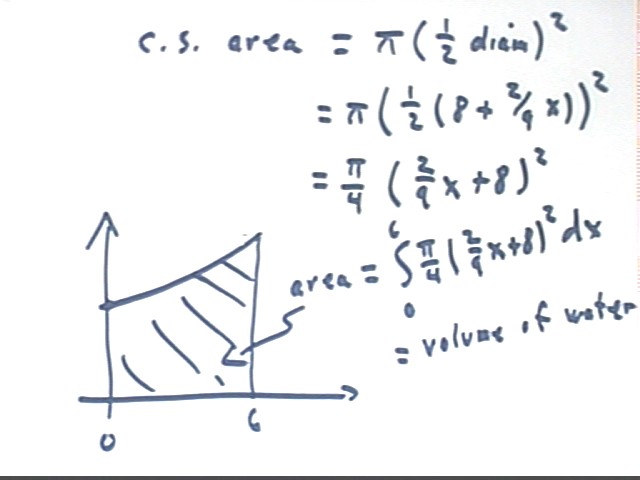
As shown below, it follows that c.s. area at height x is pi/4 (2/9 x + 8)^2.
The area under the curve from height x = 0 to height x = 6 is therefore the integral of this expression from x = 0 to x = 6, as indicated below.
This integral therefore represents the volume of water in the first 6 inches of the bucket, in units of in^3.
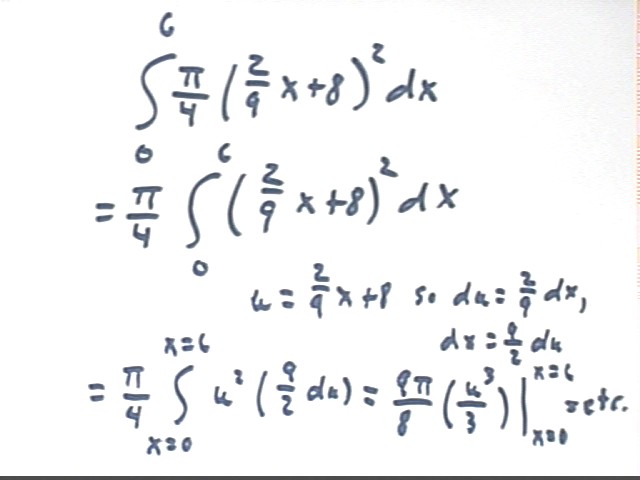
The integral is easily enough calculated.
In the second step below we bring the constant pi/4 out of the integral.
In the third step we use the substitution u = 2/9 x + 8, resulting in the integral of the last line.
The definite integral at the end of the last line can be easily calculated by either of two means:
We can substitute 2/9 x + 8 for u then evaluate at x = 0 and x = 6 and find the difference.
We can substitute x = 8 and x = 10 into u = 2/9 x + 8, obtaining u = 8 and u = 10, and evaluate the antiderivative 9 pi / 8 ( u^3 / 3) at these limits without first substituting for x.
You should check to verify that either way we get 354.65, which agrees to 3 significant figures with the result of our trapezoidal approximation.
This result indicates that to three significant figures there are 355 in^3 of water in the bucket.
It is left as an exercise to find the number of inches of rainfall corresponding to this result.
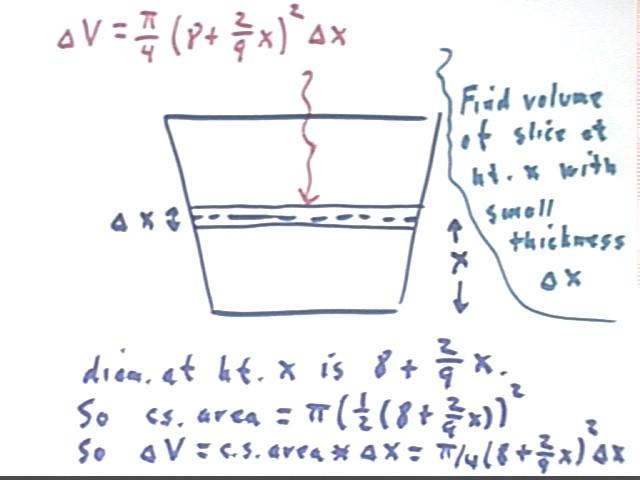
A more formal approach begins by finding the volume of a slice of thickness `dx, located at height x, as indicated in the figure below.
Using our previous results we see that the diameter at height x is 2/9 x + 8.
It follows as before that the cross-sectional area is pi r^2 = pi (1/2(2/9 x + 8))^2.
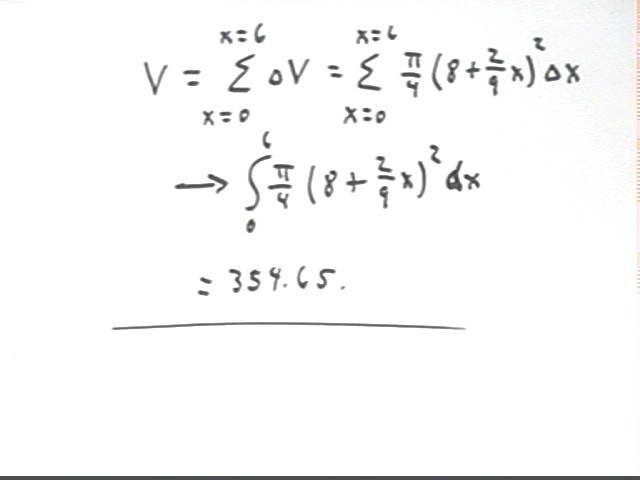
The volume of the slice is therefore c.s. area * thickness = pi/4 (2/9 x + 8)^2 * `dx.
This gives us the expression `dV = pi/4 (2/9 x + 8)^2 * `dx for the volume increment. This expression is accurate to the extent that `dx is small, since small `dx implies small change in c.s. area from the bottom of the slice to the top and ensures that the average c.s. area is close to pi/4 (2/9 x + 8)^2.
The total volume is the sum of all such volume increments, from the x = 0 height to the x = 6 in height, is as indicated in the first line.
Taking the limit of the expression as `dx -> 0 we obtain the integral indicated in the second line, which is identical to the integral we evaluated previously.