Calculus II Class 03/03
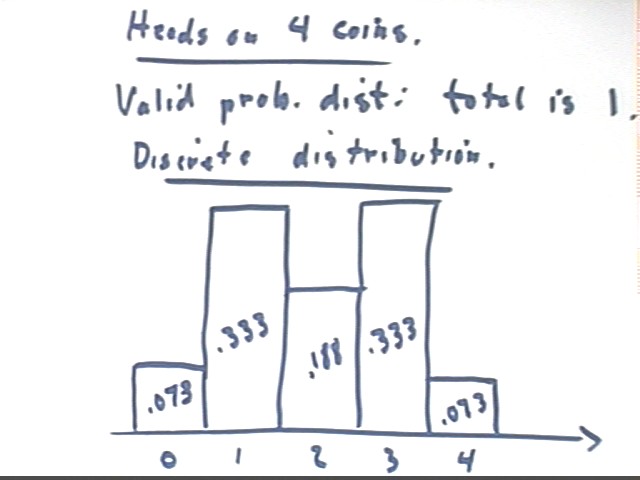
On 27 trials, flipping 4 coins on each trial and counting the number of Heads, tallies were 2, 9, 5, 9, 2 occurrences of 0, 1, 2, 3, 4 heads. Using these numbers we obtain the distribution depicted below for the proportional # of Heads on 4 coins.
We think of x as the number of Heads and y as the proportion of all occurrences which show this number.
Note that each bar of the histogram has width 1 so that the altitudes match the areas.
The distribution of number of 'heads' is a discrete distribution, since only certain discrete values (in this case 0, 1, 2, 3, 4) are possible for the variable x = number of heads.
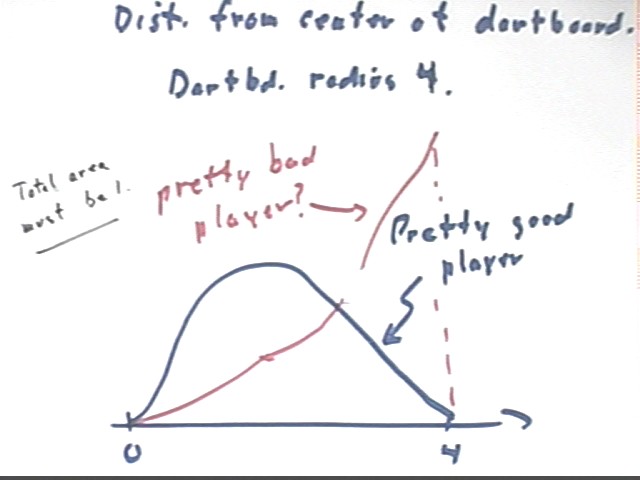
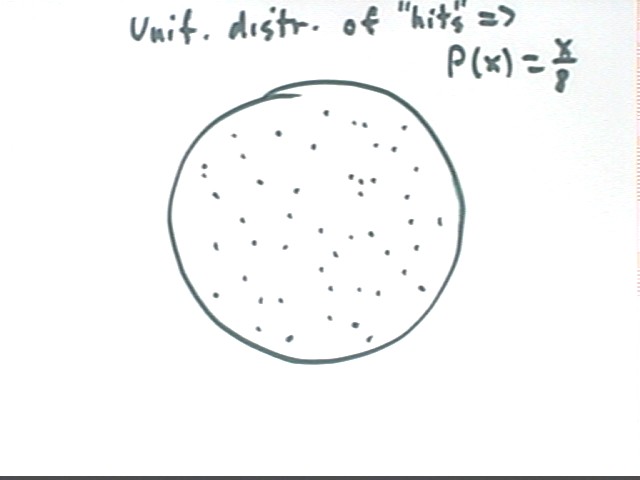
Consider a somewhat different situation. What would the distribution of the distances x of 'hits' from the center of a dartboard look like?
We wish to make these ideas more precise.
Let x be the distance a dart hits from the center of the dartboard. Suppose that the probability of hitting between distances x1 and x2 from the center of a dartboard is equal to the proportional area of the dartboard lying between x1 and x2.
If the radius of the dartboard is 4 then what is the probability Prob(x1 < x < x2)?
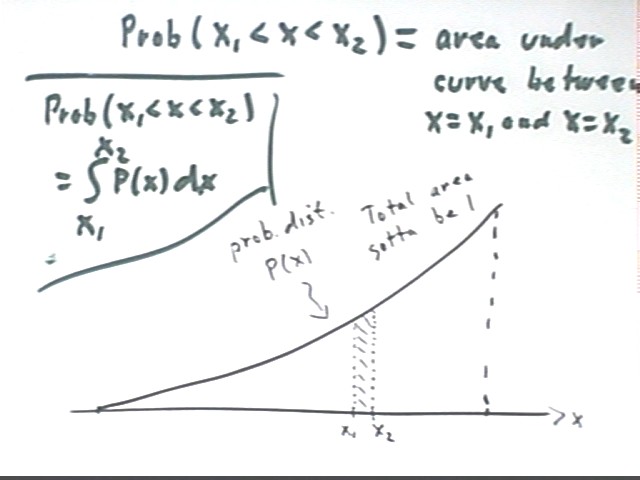
We sketch a hypothetical curve representing this situation. If p(x) is the probability distribution function then the area beneath the p(x) curve between 0 and 4 must be 1 (since we're only counting what happens when the dartboard is hit, the probability of hitting somewhere between 0 and 4 must be 1).
The probability of hitting between distances x1 and x2 from the center is represented by the area under the curve between x = x1 and x = x2.
It should be clear that this area is the integral of the probability function p(x) from x = x1 to x = x2.
We will next use the geometry of the circle to find the formula for the function p(x).
The total area between x = x1 and x = x2 is easily shown to be pi x2^2 - pi x1^2, and the total area of the circle is pi r^2 = pi * 4^2 = 16 pi.
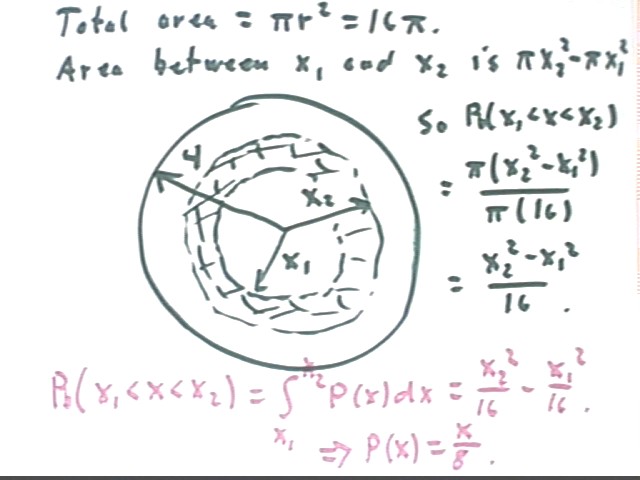
We can obtain this probability function by assuming a uniform distribution of 'hits'. A uniform distribution is indicated in the figure below. We will see in the next figure how we can use the uniformity of the distribution to construct the function p(x) = x/8.
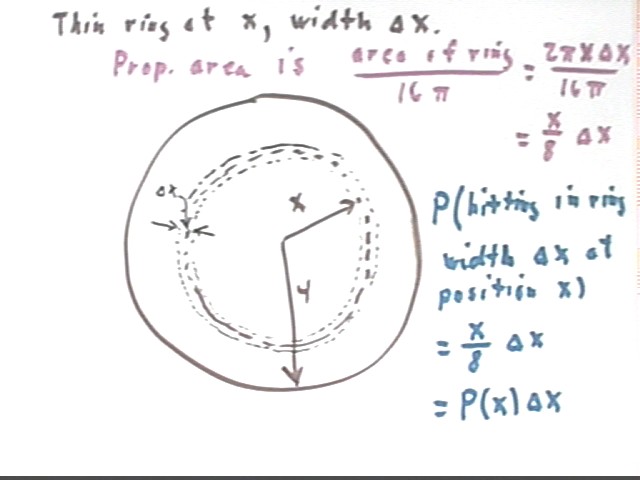
If we consider a thin ring at positoin x, having width `dx, we see that its area is approximately equal to 2 pi x `dx and that its proportional area is therefore x / 8 * `dx.
Since the probability of a hit within a small range `dx of distance x is equal to the corresponding area beneath the p(x) vs. x curve, and since for small `dx this area is close to p(x) `dx, we see that at `dx -> 0 the two quantities p(x) `dx and x/8 `dx must approach one another, so that p(x) = x/8.
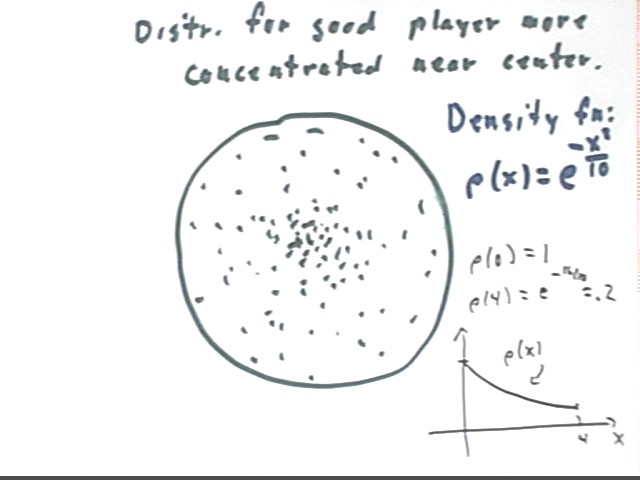
Now if we have a good player, statistical analysis will show us that the density of 'hits' over the area of the dartboard should be normally distributed, with density proportional to e^(.5 x / std dev)^2.
For the present example suppose that the density function for a certain player is rho(x) = e^(-x^2 / 10). Note that this gives rho(0) = 1 and rho(4) = .2, approx.. So the density of 'hits' near the center is about 5 times the density near the outer rim.
The density function is a decreasing exponential, as depicted in the graph at lower right below.
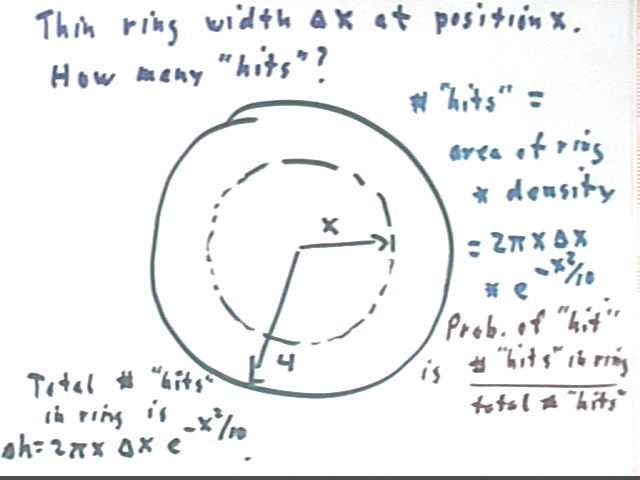
The number of 'hits' in a region is equal to the average density of the region multiplied by the area of the region.
We again consider a thin ring of width `dx at position x.
number of hits `dh = `dA * rho(x) = 2 pi x `dx * e^(-x^2/10).
The probability of a 'hit' in a certain region is the number of hits expected in that region, divided by the total number of 'hits'.
The resulting integral is shown below, as is the probability of a 'hit' within the given ring.
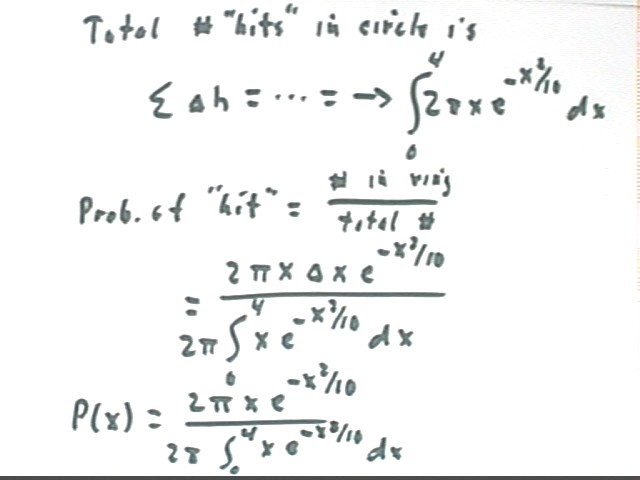
We note that the integral of p(x), from x = 0 to x = 4, must be 1. You can easily check to see that this is so.
We can simplify the expression for p(x) by dividing 2 pi by 2 pi to obtain
We can perform the integration in the denominator, using substitution u = -x^2/10 so that du = -x/5 dx and x dx = -5 du.
Our function becomes p(x) = x e^-(x^2/10) / 3.99 or approximately p(x) = .25 x e^(-x^2/10).
This function has its peak slightly past x = 2. This function is graphed below on the same graph as the uniform-density function p(x) = x / 8.
For a very good player the distribution function might be just rho(x) = e^(-x^2).
The p(x) graph for this player is also depicted above, with the peak probability occurring for x less than 1. The function for this player is 2.000000225·x·ê^(- x^2); you should be able to verify this result.
You should visually convince yourself that the area under each graph in the figure above is indeed plausibly close to 1.
You should also use derivative tests to verify that the function p(x) = .25 e^(-x^2/10) is indeed maximized for a value of x slightly greater than x = 2.
Challenge problem: If the density of 'hits' is normally distributed with rho(x) = e^-(x^2 / c) for some c, then for what value of c will the density at x = 4 be just 1% of the x = 0 density? What then will be the probability density function for 'hits'?