Calculus II Class 04/07
A square wave can be demonstrated by cranking a hand-held DC generator forward for pi = 3.14 seconds, then reversing direction for pi = 3.14 seconds (a 3-significant-figure approximation), and repeating the cycle several times. The cranking rate was such that the voltage on the forward crank was 1 volt, and on the backwards crank we again had 1 volt. A cycle corrsponds to 1 complete forward crank and one complete backward crank.
The resulting voltage vs. clock time graph is depicted below. 1 period corresponds to the 2 pi = 6.28 sec required for each cycle. We call the resulting function a 'square wave' function.
The sine wave is also depicted. Note how the peaks of the sine function meet the square-wave function, while the sine function passes thru the x axis every time the square wave reverses itself.
sin(x) doesn't exactly model the square-wave function but it's 'up' at the right times and down at the right times. It just doesn't flatten out at top and bottom as we might wish. Sketch a graph of sin(3x) on the same graph as that of sin(x). When sin(x) is zero, what is the value of sin(3x)? When sin(x) passes through the x axis how does its direction compare to that of sin(3x)? When sin(x) peaks, what happens to the graph of sin(3x)?
y = sin(x) is zero at x = 0, pi, 2 pi, 3 pi, etc., passing thru the first zero while increasing, the second while decreasing, and alternating increasing and decreasing behavior with each subsequent zero.
y = sin(3x) is zero everytime 3x takes value 0, pi, 2 pi, 3 pi, etc., alternating increasing and decreasing behavior in the same manner. The corresponding x values are 0, pi/3, 2 pi/3, pi, 4 pi/3, 5 pi/3, 2 pi, etc.. We see that every third zero of sin(3x) corresponds to a zero of sin(x), and that at these zeros sin(3x) is increasing or decreasing the same as sin(x).
If we allow 'upward' and 'downward' peaks, y = sin(x) peaks at x = pi/2, 3 pi/2, 5 pi/2, etc., 'upward' peaks alternating with 'downward' peaks. At these x values we see that y = sin(3x) also peaks, but in the opposite direction, 'downward' peaks of sin(3x) occuring at the same x values as 'upward' peaks of sin(x), and vice versa.
If we add sin(3x) to sin(x), how well does the result 'flatten' the peak of sin(x)? How does the result reinforce the increasing or decreasing behavior at the zeros of sin(x)?
Since upward peaks of sin(x) correspond to 'downward' peaks of sin(3x) and vice versa, these peaks are flattened very well--too well, in fact, with the graph of the sum being zero at these points.
We see that since sin(3x) is zero and increasing at every point where sin(x) is zero and increasing, and that sin(3x) is zero and decreasing at every point where sin(x) is zero and decreasing, at these points the sum sin(x) + sin(3x) must be either increasing or decreasing even faster than sin(x).
The resulting graph is shown below.
sin(x) + sin(3x) isn't very flat on top but it can give us an idea. The problem is that adding sin(3x) brings each peak of the sin(x) function all the way back to zero. What is we just add 1/2 of sin(3x). How does sin(x) + sin(3x) / 2 do a better job of flattening the peaks of the sine function than adding sin(3x)? Describe the graph of sin(x) + sin(3x) / 2 and how this graph begins to approximate a square wave.
Adding sin(3x) / 2 to sin(x) brings us down only about halfway back to zero each peak of sin(x). The peaks on either side of this 'central dip' are closer to y = 1 or y = -1 values of the square wave.
The graph of y = sin(x) + sin(3x) / 2 is depicted below.

What if we construct the graph of y = sin(x) + sin(3x) / 3. Does this come closer to the square wave than the graph of y = sin(x) + sin(3x) / 2?
This graph of y = sin(x) + sin(3x) / 3, depicted below, does even better near the peaks, staying even closer to +1 or -1 through each of its cycles. However note that the square wave rises and falls vertically at its 'sides', while the graph of the present fuction doesn't rise quite and fall quite as fast as that of y = sin(x) + sin(3x) / 2.
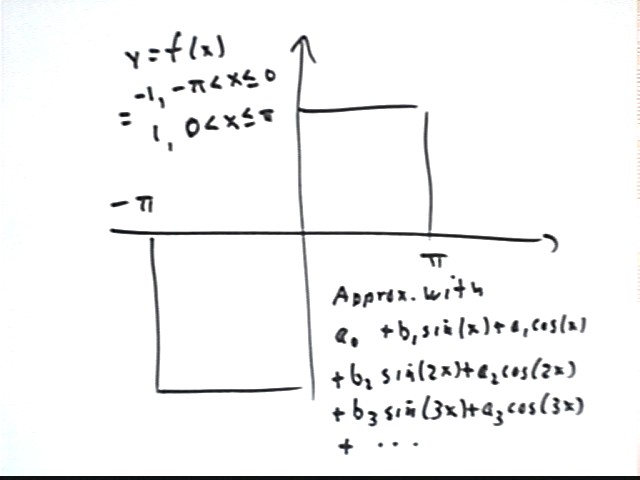
Our goal here will be to find a series of sine and cosine functions that model a single period of a square wave from x = -pi to x = pi. Sketch a graph of this function, with y = -1 from x = -pi to 0 and y = 1 from y = 0 to y = 1.
The graph is depicted below.
Our goal will be to approximate this graph with a series formed by adding multiples of sin(x), sin(2x), sin(3x), ..., as well as cos(x), cos(2x), cos(3x), ... .
We will use b1, b2, b3, ... for the coefficients of sin(x), sin(2x), sin(3x), etc., and a1, a2, a3, ... for the coefficients of the corresonding cosine functions. We will also use a0 as a constant term.
For an extensive class of periodic functions f(x), including the square-wave function we are currently analyzing, the coefficients a0, b1, a1, etc. are given by the integrals in the figure below.
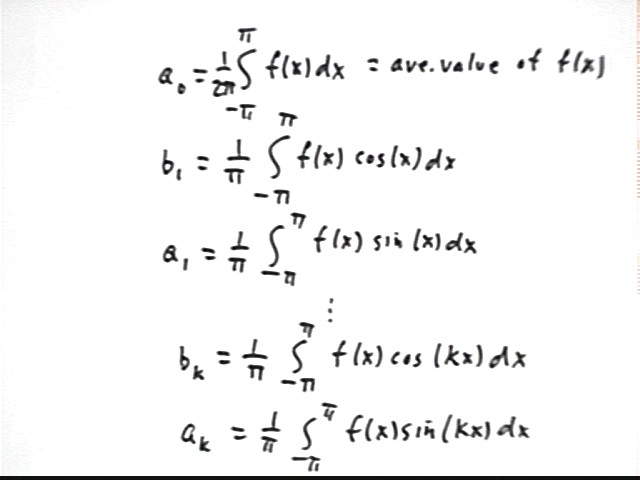
As depicted in the preceding solution each of the constants a0, a1, a2, ... and b1, b2, ... is defined in terms of the integral of f(x) with the corresponding function. If f(x) is our step function (-1 from x = -pi to x = 0, 1 from x = 0 to x = pi) then what is the integral of f(x) from -pi to pi and what is the corresponding value of a0?
The integral of f(x) is easily visualized as the 'area beneath the curve', where areas below the x axis are taken as negative and areas above the x axis as positive. Since the graph of this step function consists of two rectangles, each of area pi * 1 = pi but one below and one above the x axis the total 'area' is -pi + pi = 0.
Note that f(x) is an odd function, with f(-x) = -f(x) so that everything that happens at a point to the right of the y axis happens 'in reverse' at the corresponding distance to the left. This causes the 'areas' to the left of the axis to be negative when those to the right are positive, and vice versa.
Sketch a graph of the step function f(x) and the function y = cos(x), both on the same graph. Then sketch the function y = f(x) * cos(x) on this graph. Describe your graph.
y = cos(x) takes value 1 when x = 0 and descends as we move to the right or the left, reaching value -1 at x = -pi and x = pi. The interval -pi < x < pi corresponds to a complete period of the cosine function. The cosine function is an even function.
When we multiply the cosine function by f(x) the portion of the y = cos(x) graph to the right of y = 0 is unchanged, since to the right of the y axis we have f(x) = 1 so that f(x) cos(x) = cos(x). To the left of y = 0 we have f(x) = -1 so that f(x) cos(x) = -cos(x), which 'flips' the graph of the cosine function with respect to the x axis. The result is depicted below.
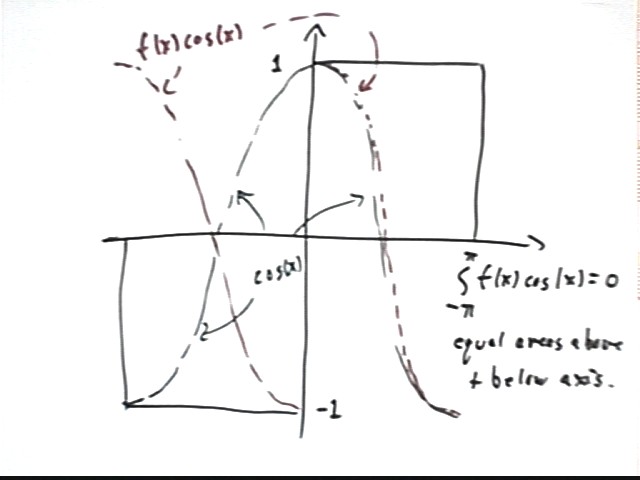
What is the integral of f(x) cos(x) from x = -pi to x = pi?
We could perform the integral symbolically and the result would be zero. However it is a good idea here to see geometrically as well as analytically why this is so.
On each side of the y axis the graph of f(x) cos(x) has a region above the x axis and a region below. These regions are completely symmetric, so the 'positive' and 'negative' areas cancel, giving us total 'area' of zero.
Sketch a graph of f(x) * cos(2x) and explain why the integral of this function is zero.
The graph of y = cos(x) goes through a complete cycle between x = -pi and x = 0, and another complete cycle between x = 0 and x = pi. Each complete cycle consists of equal 'positive' and 'negative' areas and therefore has integral 0. Multiplying the cycle to the left of the y axis by -1 does not change this fact.
We can also see from this graph that f(x) * cos(2x) is an odd function, exactly opposite in sign at any two points at equal distances to the left and right of the y axis. Thus 'areas' to the right and the left of the y axis cancel.
We note that the product of an even and an odd function is always an odd function.
These same observations can be made for f(x) cos(kx), for any value of k.
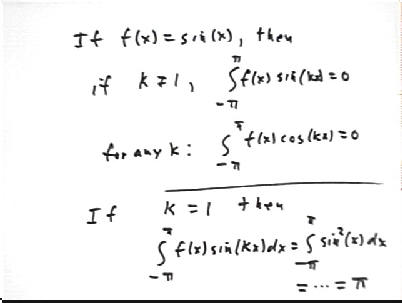
So note that for the given square-wave function, in fact for any odd function, the integral of f(x) cos(kx) over the interval -pi < x < pi is zero.

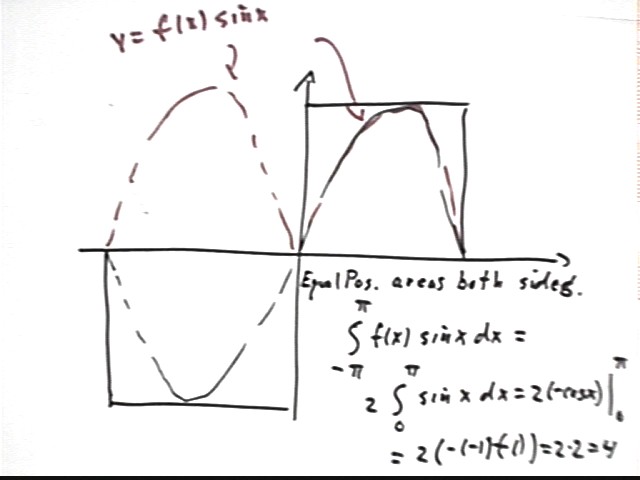
Sketch a graph of y = f(x), y = sin(x) and y = f(x) sin(x) between x = -pi and x = pi. What is the integral of f(x) sin(x) between x = -pi and x = pi?
The sketch shows that y = sin(x) is an odd function, as is y = f(x).
For negative values of x, since f(x) = -1 we see that y = f(x) sin(x) will be 'flipped' about the x axis, whereas for positive x we find that y = f(x) sin(x) will be identical to y = f(x).
The result will be that y = f(x) sin(x) will consists of two identical positive 'humps'. The integral of f(x) sin(x) from x = -pi to x = pi will there for be equal to double the integral of sin(x) from x = 0 to x = 1.
As shown below the desired integral is 2 * 2 = 4.
It follows that b1 = 4 / pi, so that the first number in our Fourier series is 4 / pi * sin(x).
What integral do we need to calculate to get a2?
From the formulas a2 = 1 / pi * integral(f(x) * sin(2x), x from -pi to pi)).
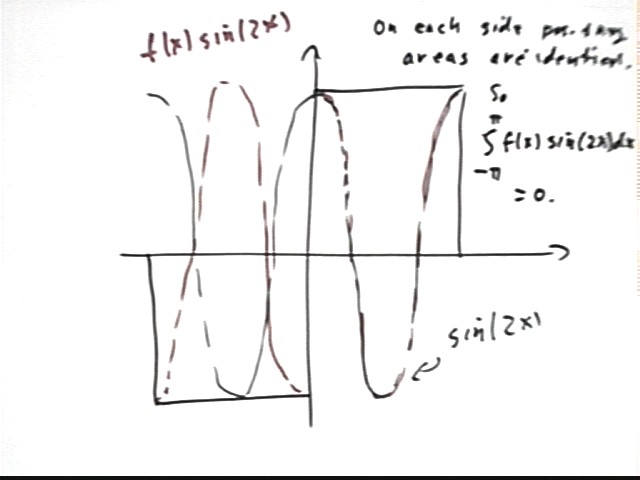
What is the integral of f(x) sin(2x) from x = -pi to pi? Use symmetry, common sense and the fact that the integral of sin(x) from x = 0 to x = pi is 2.
The graph of f(x) sin(2x) is depicted in red in the figure below. As in previous examples this function is equal to the sin(2x) function to the right of the y axis, while to the left the graph shows how f(x) sin(2x) is 'flipped' about the x axis relative to the graph of sin(2x).
To the right of the y axis the graph has a negative 'hump' and two positive 'half-humps'. The total area above the x axis is therefore equal to the total area below and the integral to the right of the y axis is zero.
The same argument can be made for the portion of the graph to the left of the y axis.
The integral is therefore zero.
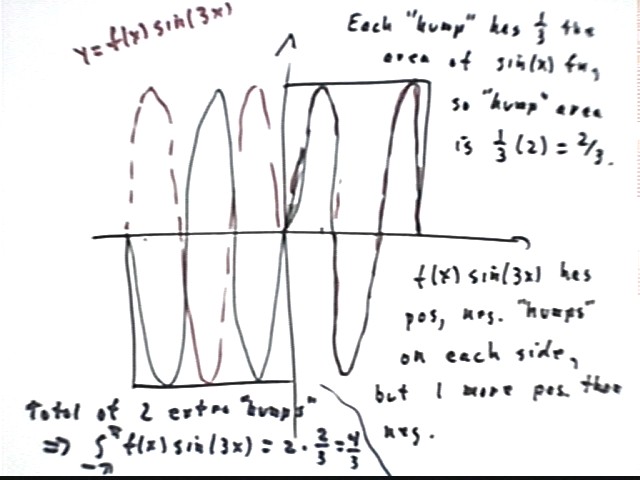
What is the integral of f(x) sin(2x) from x = -pi to pi? Use symmetry, common sense and the fact that the integral of sin(x) from x = 0 to x = pi is 2.
To the right of the y axis the graph has two positive and one negative 'humps', each of whose area is 1/3 that of the single 'hump of the sin(x) function (recall that the integral of a single 'hump' of the sine function is 2). The area of each 'hump' of y = sin(3x) is therefore 2 / 3.
The net area is that of a single 'hump' so the integral from 0 to pi is therefore 2/3.
The 'flipped' graph to the left of y = 0 also has two positive and one negative 'hump' so the integral of f(x) sin(3x) from x = -pi to 0 is also 2/3.
The integral of f(x) sin(3x) from x = -pi to pi is therefore 4/3.
How does symmetry show us that the graph of y = f(x) sin(kx) = 0 for k = 2, 4, 6, 8, ... ?
We've already seen how the graph of y = f(x) sin(2x) gives us a negative 'hump' and two positive 'half-humps' to the right of the y axis, giving us total 'area' zero; and a positive 'hump' and two negative 'half-humps' to the left of the y axis, again indicating that the integral is zero.
The graph of f(x) sin(4x) will undergo 2 additional cycles, one on each side of the y axis. Each additional cycle has identical positive and negative 'humps' and therefore gives us net area zero.
So additional cycles do not affect the fact that the integral is zero.
The same argument applies in turn for sin(6x), sin(8x), etc..
For any even k we the integral of f(x) sin(kx) is therefore zero.
Using symmetry, common sense and the fact that the integral of sin(x) from x = 0 to x = pi is 2, explain why the integral of f(x) sin(kx) = 4 / k whenever k is odd.
We have seen that for k = 3 the graph of f(x) sin(kx) has 'humps' whose area is 1/3 that of the area of a single 'hump' of the sin(x) graph, whose area is 2.
For k = 5 each 'hump' will have 1/5 the area of a single 'hump' of the sin(x) graph, or area 2/5. For k = 7 and k = 9 the area of each 'hump' will be 2/7 and 2/9.
For k = 3 there was one positive 'hump' left over on each side of the y axis after canceling the positive and negative 'humps', so that the integral on each side was 2/3, giving us total integral 4/3.
For k = 5 we will have two more cycles of sin(kx), one on each side of the y axis. Each of these cycles will add nothing to the integral, since its positive and negative 'humps' will cancel. So there will again be just one leftover 'hump' on each side, each contributing 2/5 to the integral. So the integral will be 4/5.
The same will be true in turn for any odd k. We will have a 'hump' with area 2 / k left on each side, giving us total integral 4 / k.
What is the resulting Fourier series?
The coefficients a0, a1, a2, a3, a4, ... of the functions cos(kx) are all zero.
The even coefficients b2, b4, b6, ... of the functions sin(2x), sin(4x), sin(6x), ... are all zero.
Only the odd coefficients b1 = 4 / pi, b3 = 4 / (3 pi), b5 = 4 / (5 pi), ... are nonzero, giving us the series
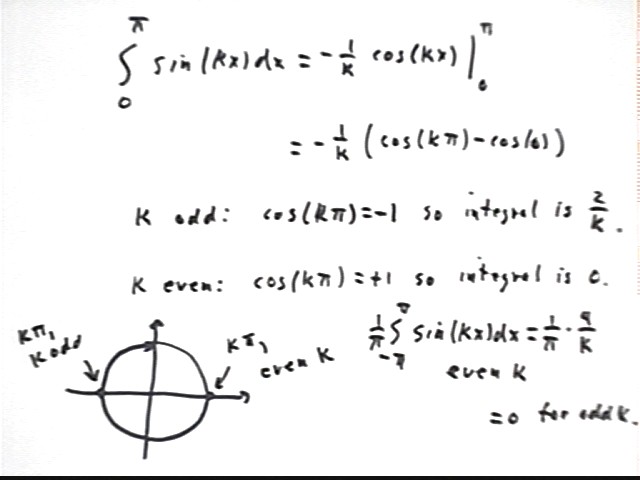
Without referring to the graph evaluate the integral of sin(kx) from x = 0 to pi. For odd k, what is the result? For even k, what is the result?
An antiderivative of sin(kx) is 1 / k * cos(kx), so as shown below the integral is equal to -1/k ( cos(k pi) - cos(0) ).
The circular model, depicted at lower left, shows that
What do we get when we integral cos(k x) for x = 0 to pi?
Our antiderivative is 1/k sin(kx), which is zero at both x = 0 and x = pi. So our integral is 1/k (sin(k * pi) - sin(k * 0) = 1/k ( 0 - 0 ) = 0. This is in agreement with our previous geometric arguments.