Notes from Class 101013
My choice of the equation x^2 / 9 - y^2 / 25 - z^2 / 16 = 1
was unfortunate. I've reworked the notes using the equation x^2 / 9 + y^2 / 25 + z^2 / 16 = 1.
This document will be our foundation for Chapter 11.
It goes beyond the text sections assigned, but it doesn't use anything you don't
already know.
In this document we do the following:
- Construct and sketch three 'slices' of the ellipsoid
parallel to the x-y plane, and three 'slices' parallel to the x-z plane.
- For the graph of an unspecified function z = f(x, y),
sketch slices through an arbitrary point (x0, y0), parallel to the xz and yz
plane of an unspecified surface, note some properties of the resulting
two-dimensional graphs, and think about what these properties tell us about
the 3-dimensional graph.
- Define the partial derivative functions f_x (x, y)
and f_y (x, y) in terms of the two-dimensional 'slices' of the 3-dimensional
graph.
- Take a closer look at slices of another unspecified
function z = f(x, y), show how f(x, y) and its partial derivatives f_x (x,
y) and f_y (x, y) give us two independent vectors tangent to the
3-dimensional graph, and show how these vectors can be used to find the
equation of the plane tangent to the 3-dimensional graph.
- Take a look at some computer-generated images related
to these constructions.
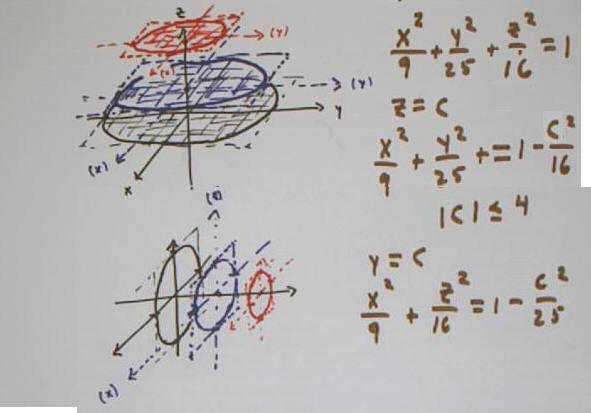
We're going to start by constructing a rough picture of the ellipsoid
x^2 / 9 + y^2 / 25 + z^2 / 16 = 1.
We begin by constructing the intersection of the ellipsoid
with the planes z = 0, z = 1 and z = 3.
- In the plane z = c the graph is a function of x and
y, with x^2 / 9 + y^2 / 25 = 1 - c^2 / 16.
- This can be rearraged to get x^2 / (9 * (1 - c^2/16)
) + y^2 / (25 * (1 - c^2/16) ) = 1.
- From this we see that the semimajor and semiminor
axes are 5 sqrt( 1 - c^2 / 16) (in the y direction) and 3 sqrt( 1 -
c^2 / 16) (in the x direction).
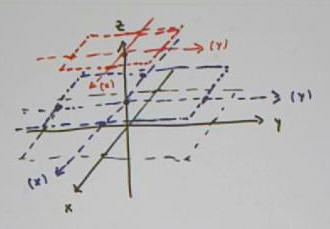
We plot the corresponding rectangles in below.
For example to plot the c = 3 rectangle, indicated in
red in the figure below:
We start by sketching auxiliary x and y axes
centered at the z = 3 point of the z axis. The auxiliary x axis is
parallel to the x axis of the 3-dimensional coordinate system, and the
auxiliary y axis parallel to the y axis of our 3-d coordinate system.
We mark points on these auxiliary axes, at x = +-
3 sqrt( 1 - 3^2 / 16) and y = +-5 sqrt( 1 - 3^2 / 16).
We then sketch the rectangle passing through these
points, with sides are parallel to the auxiliary axes.
We construct similar rectangles in the c = 1 and c = 0
planes.
We now sketch the ellipse inscribed in each rectangle.
Each ellipse will be tangent to the side of its rectangle at the point where the
side meets an axis.
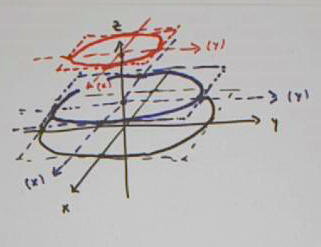
We go ahead and risk shading the ellipses.
The figure isn't particularly well sketched; if we
visualize the surface in the sketch it looks more like a cone than an ellipsoid.
The 'blue' rectangle should have been larger. See if you can improve on
this sketch.
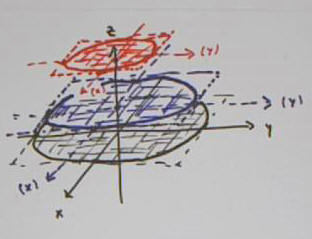
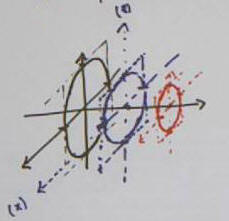
In the figure below we sketch the rectangles corresponding
to the planes y = c, for c = 0, 1 and 2.
We then fill in the ellipses, as before. Once again the
figure indicates something that looks more like a cone than an ellipse.
The entire picture, including the equations
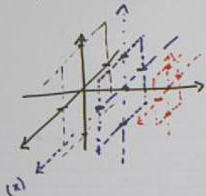
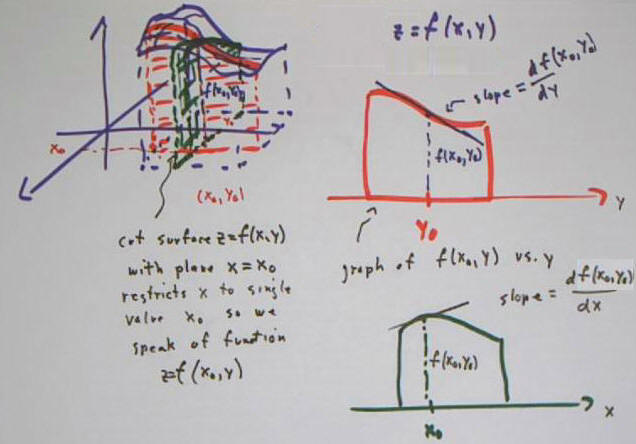
In general if we cut a surface in 3-dimensional space with
a plane, we get a curve.
In the figure below we depict the curves that correspond
to cutting the graph of an function z = f(x, y) with the planes x = x0 and y =
y0.
These planes meet in the x-y plane at the point (x0,
y0).
In each plane we get a curve. In the x = x0
plane we get the curve depicted in red; in the y = y0 plane the curve is
depicted in dark green.
The curve in the x = x0 plane is depicted in a z vs. y
graph at top right. The function is z = f(x, y). By restricting
the function to the plane x = x0, we obtain the graph of a new function z =
f(x0, y), which is a function solely of the variable y. The variable x
has been replaced by the constant, specific value x0.
- When we plug in the specific value y = y0, we see
that this function z = f(x0, y) takes value z = f(x0, y0) at this point.
The derivative of this function is df(x0, y) / dy.
- We can denote this derivative function as f_y
(x0, y), where the subscript -y indicates derivative with respect to y.
- At the y = y0 point the value of this derivative
is f_y ( x0, y0 ). This value indicates the slope of the function
z = f(x0, y) at the point y = y0.
- In the figure below this curve is depicted with a
negative slope at the y = y0 point.
Similarly the curve in the y = y0 plane represents the
z vs. x function z = f(x, y0).
- The curve is depicted at bottom right, in green
- The derivative of this function is the function
f_x (x, y0).
- At the x = x0 point the value of the derivative
if f_x (x0, y0), and corresponds to the slope of the graph of z = f(x,
y0) at the x = x0 point.
You should picture the 'slope segments' of the two
graphs within the 3-dimensional sketch at top left.
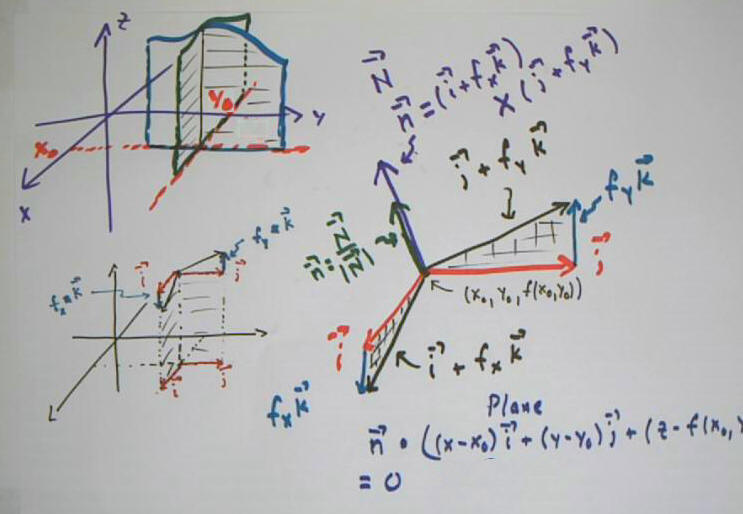
The figure below is similar in nature, but depicts the
slicing of a different graph by the planes y = y0 and x = x0. The
intersections are respectively rendered in blue and dark green (which might
appear black).
- The two slices meet in the x-y plane at (x0, y0).
- When the z vs. y and z vs. x graphs intersect it is
at the common z value z = f(x0, y0). So the intersection point of the
'blue' and 'dark green' graphs is (x0, y0, f(x0, y0) ).
- The 'blue' graph clearly has a positive slope at this
point. The 'green' graph is taken to have a negative slope.
- The slope of the 'blue' graph at this point is f_y
(x0, y0), and the slope of the 'green' graph is f_x (x0, y0). These
values are abbreviated f_y and f_x in the figure below.
- The graph at lower left depicts the (x0, y0) point in
the x-y plane, with the `i and `j unit vectors both originating at this
point.. At the point (x0, y0, f(x0, y0) ) the `i and `j vectors are
again depicted, along with the vectors f_y `k and f_x `i.
- It should be clear that the vector `j + f_y `k is the
vector tangent to the 'blue' curve at the point (x0, y0, f(x0, y0), and the
vector `i + `f_x `k is similarly tangent toto the 'green' curve.
The two tangent vectors lie in the 'tangent plane', the
plane tangent to the graph of z = f(x, y) at the point (x0, y0, f(x0, y0)).
- A vector N normal to the plane is
obtained by calculating the cross product of the two tangent vectors.
- We can if we wish divide the vector N by its
magnitude to get a unit normal vector n.
- The tangent plane therefore passes through the point
(x0, y0, f(x0, y0)) and is normal to the vector n.
- The condition for a point (x, y, z) to lie on this
plane is that the vector (x - x0) `i + (y - y0) `j + (z - z0) `k,
originating at (x0, y0, z0) and terminating at (x, y, z), be perpendicular
to n.
- Representing this condition as a dot product we
obtain the equation for the tangent plane.
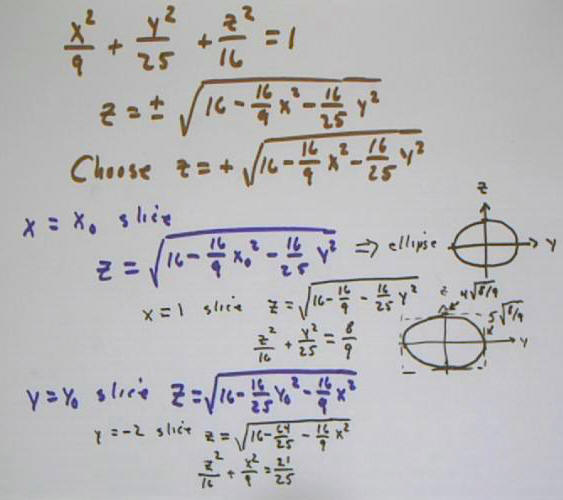
We apply these ideas to the function z = f(x,y) =
sqrt(16 - 16/9 x^2 - 16/25 y^2), the graph of which coincides with the upper
half of the ellipsoid x^2 / 9 + y^2 / 25 + z^2 / 16 = 1, sections of which were
graphed at the beginning of this document.
- We substitute x = x0 to get the general equation z =
sqrt(16 - 16/9 x0^2 - 16/25 y^2) of an x = x0 slice, the graph of which is
an ellipse in a y-z plane.
- For example the x = 1 slice is z = sqrt(16 - 16/9 -
16/25 y^2), giving us the ellipse z^2 / 16 + y^2 / 25 = 8/9 (just square
both sides of z = sqrt(16 - 16/9 - 16/25 y^2) and simplify). If we put
this equation into standard form we find that the semimajor and semiminor
axes are 5 sqrt(8/9) and 4 sqrt(8/9). Of course these expressions can
be simplified (we get 5 sqrt(8) / 3 and 4 sqrt(8) / 3), but in the figure
they are left unsimplified to make the numbers easier to connect.
- We similarly show the formula for the y = y0 slice,
and the specific the y = -2 slice.
Looking more closely at the x = 1 and y = -2 slices:
- We calculate dz/dy for the x = 1 slice z = sqrt(8/9 -
16/25 y^2).
- We graph the ellipse for the x = 1 slice and depict
the tangent line at y = -2.
- Evaluating dz/dy for y = -2 we get the approximate
value 0.38 of the slope at that point.
- We conclude that at the x = 1, y = -2 point the
tangent line corresponding to this slice is parallel to the vector `j + .38
`k,
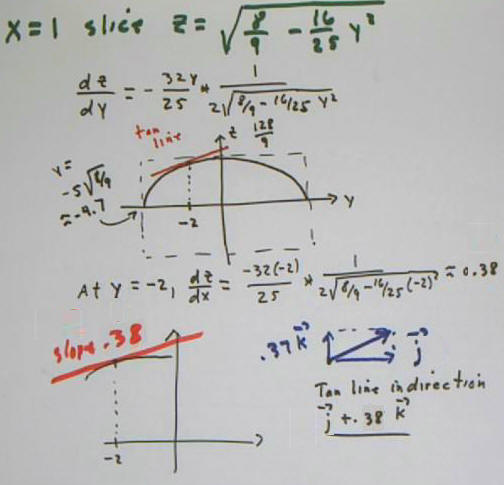
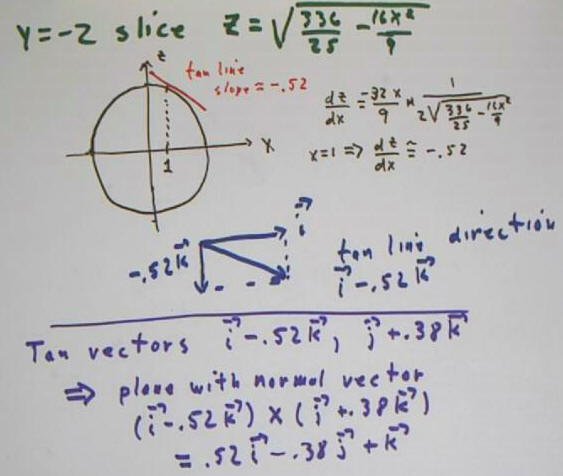
A similar analysis of the y = -2 slice gives us the
tangent vector `i - .52 `k.
The cross product of our two tangent vectors is .52 `i -
.38 `j + `k.
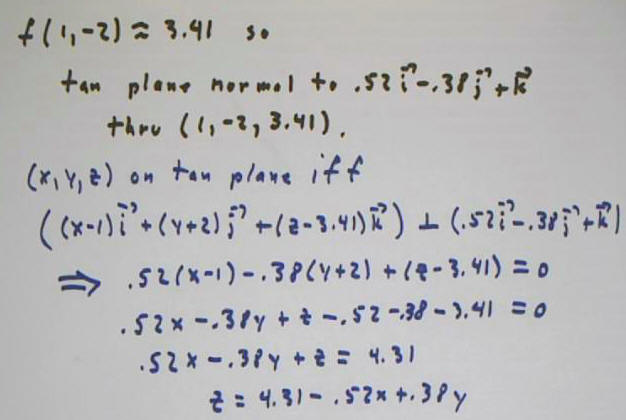
The value of f(x, y) at x = 1, y = -2 is easily found by
substituting x and y into our z = f(x, y) function to be
- z = f(1, -2) = sqrt(16 - 16/9 * 1^2 - 16/25 * (-2)
^2) = 3.41, approx.
Our tangent plane is therefore the plane through the point
(1, -2, 3.41) having normal vector .52 `i - .38 `j + `k.
We conclude that the tangent plane is given by the
equation z = 4.31 - .52 x + .38 y.
These techniques were applied here to the graph of a
quadric surface, but can be applied to any decently-behaved function f(x, y).
A brief summary of some main ideas:
The derivatives f_x (x, y) and f_y (x, y) are called
the partial derivatives of f with respect to x, and with respect to y.
- If you have the formula for f(x, y), then f_x is
found by taking the derivative with respect to x while treating y as a
constant, and f_y by taking the derivative with respect to y while
treating x as a constant.
In general, at the point (x0, y0, f(x0, y0) ) on the
graph of z = f(x, y):
- the y = y0 slice yields a function of x, whose
slope at x = x0 is f_x (x0, y0)
- the x = x0 slice yields a function of y, whose
slope at y = x0 is f_y (x0, y0)
- the vectors `i + f_x `k and `j + f_y `k are
tangent at (x0, y0, f(x0, y0) ) to the surface formed by the
3-dimensional graph
- the cross product of these vectors is normal to
the plane tangent to the 3-dimensional graph at the given point
- knowing the normal vector and point we easily
find the equation of the tangent plane
We depict this situation using computer graphics:
From x^2 / 9 + y^2 / 25 + z^2 / 16 = 1 we can solve so get
z = +- sqrt( 16 - x^2 / 9 - y^2 / 25).
Plotting most of both
z = sqrt(16 - x^2 / 9 - y^2 / 25) and
z = -sqrt(16 - x^2 / 9 - y^2 / 25)
(leaving out some of the 'middle') we get the
'broken-eggshell' figure below.
Intersected with the plane z = 3 we get
Intersecting the 'upper-half' function
z = f(x, y) = sqrt(16 - x^2 / 9 - y^2 / 25)
with the plane x = 1 we get the function
z = sqrt(16 - 1/9 - y^2 / 25),
which is an ellipse in the plane x = 1.
The intersection of the plane with the surface is seen
below. You can easily see that this intersection appears to be the upper
half of an ellipse.
Intersecting the surface also with plane y = -2 we get the
figure below.
In the plane y = -2 our f(x, y) function becomes
z = sqrt(16 - 4 / 25 - x^2 / 9 ),
which is an ellipse in x and z.
Rotated a bit:
Evaluating f(x, y) at x = 1, y = -2 we get value 3.41.
So the point (1, -2, 3.41) should lie on our surface.
Intersecting our surface with plane z = 3.41 we get the
figure below. Note that the three planes and our surface appear to
come together at a point. The three planes must intersect at (1, -2, 3.41)
so this point does appear to lie on the surface.
Additional perspective of the common intersection point,
from a little ways below x-y plane
The 'blue' vector in the next figure is tangent to our
surface at the common intersection point, along the curve formed where the
surface intersects the plane x = 1.
If we take the y derivative of our f(x, y), and evaluate
it for x = 1 and y = -2, we get about 0.38. This is the slope of the curve
formed in the plane x = 1, at the y = -2 point of that curve. This
indicates that the 'blue' vector in the figure is `j + .38 `k.
The 'blue' vector in the figure below is tangent at the
common intersection point to the curve formed in the plane y = -2.
If we take the x derivative of our f(x, y), and evaluate
it for x = 1 and y = -2, we get about -0.52. This is the slope of the
curve formed in the plane y = -2, at the x = 1 point of that curve. This
indicates that the 'blue' vector in the figure is `i + .52 `k.
The cross product of our two 'blue' vectors is
perpendicular to the plane formed by those vectors.
It is easily seen that the cross product is .52 `i - .38
`j + `k.
The intersection point is (1, -2, 3.41).
So the plane formed by the two vectors, at the point of
common intersection, is
-.52 ( x - 1 ) - .38 ( y + 2) + 1 ( z - 3.41) = 0
Solving for z we have
z = -.52 x - .05 y + 3.83
The plane z = 3.83 - .52 x - .05 y intersected with the
surface:
Adding the planes x = 1, y = -2, z = 3.41:
From various perspectives: