ic_class_090902
ic_class_090902
course Phy 201
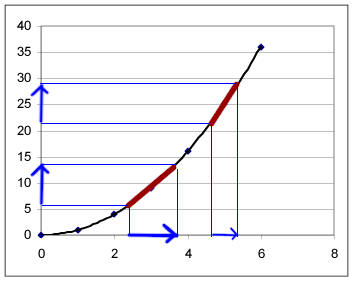
The position vs. clock time graph
We extensively discussed the position vs. clock time graph
in class.
In class I saw a number of carefully constructed graphs, many with sufficient detail to give good results. Some of the graphs did not have particular smooth curves, and/or were too small to yield good results.
If necessary you should sketch another graph, of sufficient size and accuracy to give you reasonably good results. Refer to the instructions given for the preceding class.
Using your graph estimate the following. You may use cycles of your pendulum, or half-cycles, as your time unit, or you can convert these to seconds.
What was the length of your pendulum (you can give this in centimeters, inches, miles, textbook widths, lines on your notebook paper or whatever units are convenient, as long as these units can later be measured in centimeters)? &$&$ 7cm.
What is the change in position corresponding to the first
half of the time interval corresponding to motion down the incline (we will use
`dt_total to refer to this time interval)?
&$&$
In class we sketched the graph and used a horizontal arrow to represent the
time down the ramp. Then we used horizontal arrows to represent the first half
of the time, and the second half of the time down the ramp. If you were to do
the same thing with your graph, you would be able to estimate how much change
in clock time corresponds to each arrow. This would not necessarily help you
answer this question, but would serve to help orient you to the graph.
We then used vertical arrows to estimate the corresponding positions on the graph. Based on estimates of the distance corresponding to each vertical arrow, you can estimate the position of the ramp at each clock time. Based on your estimates you can estimate the distances requested in this question and the next.
Answer the same for the second half of the interval.
&$&$
Darken the part of the graph which corresponds to motion
down the fourth ramp. For this interval estimate the change in position and the
change in clock time. &$&$
Mark the point of the graph that corresponds to the ball's
first contact with the seventh ramp. Give the coordinates of that point.
&$&$ 7.5, 6
Do the same for the ball's last contact with the seventh
ramp. &$&$ 7.8,7
What is q_rise between these
points (recall that q_rise stands for 'the quantity
represented by the rise')? &$&$ 7.5/7.8=.961
You get the rise by subtracting, not by dividing the two 'graph altitudes'.
W$hat is q_run
between these points? &$&$ 6/7=.857
You get the run by subtracting, not by dividing the two horizontal
coordinates.
Note also that the 6 ft and 7 ft positions are on the 'vertical' axis, not
the horizontal. So the rise is determined by these coordinates. Similarly the
run is determined by your clock times 7.5 seconds and 7.8 seconds.
Your estimates 7.5 sec and 7.8 sec are perfectly reasonable, so if you use
subtraction and correct the order of your rise and run, you will get a very
good result.
$What therefore is q_slope between
these points? .961/.857=1.121
Mark on your graph the points corresponding to the
transitions from one ramp to the next (i.e., the ball leaves one ramp and first
encounters the other at the same instant; mark each on the graph at which this
occurs).
Sketch a series of short straight line segments connecting
these points.
Find q_rise, q_run and q_slope for each of these line segments. Report q_rise, q_run and q_slope, in that order and separated by commas, starting in the line below. Report three numbers in each line, so that each line represents the quantities represented by the rise, run and slope of one of your segments.&$&$
The v0, vf, `dt trapezoid
The altitudes of a certain graph trapezoid are symbolically
represented by v0 and vf, indicating initial and
final velocity.
The base is represented by `dt,
the change in clock time t. The base therefore represents the time interval `dt.
Sketch a graph trapezoid. Label its altitudes v0 and vf and its base `dt.
Now answer the following questions:
If v0 = 5 meters / second and vf =
13 meters / second, with `dt = 4 seconds, then
What is the rise of the trapezoid and what does it
represent? &$&$ The rise is Vf-Vo=13-5=8
Good, but that would be 13 meters/second - 8 meters/second = 5
meters/second. The units are essential.
What is the run of the trapezoid and what does it represent?
&$&$ 4
Good, but the run would be 4 seconds, not just the number 4.
What is the slope of the trapezoid and what does it
represent? &$&$ 8/4=2
Very good, but this would be (8 meters/second) / (4 seconds) = 2 meters /
second^2. Many students will still be a little 'fuzzy' with the units; students
who are should do a good review of division of fractions.
What are the dimensions of the equal-area rectangle and what
do they represent? &$&$ 6.5*4
The altitude will have the same units as the 'graph altitudes' of the
trapezoid. The 'graph altitudes' are expressed in meters/second, so the
altitude of the equal-area rectangle will be meters/second.
The altitude of the equal-area rectangle would be halfway between the
altitudes 5 meters/second and 13 meters/second. Halfway between 5 and 13 is 9
(most easily calculated by adding 5 and 13 and dividing by 2). The altitude of
the equal-area rectangle is therefore 9 meters/second.
The width is not 4 but 4 seconds.
So the area is 9 meters/second * 4 seconds = 36 meters.
Be sure to review multiplication of fractions so you will fully understand
the units calculation.
What therefore is the area of the trapezoid and what does it
represent? &$&$ 6.5*4=26 area of trapezoid
The vertical coordinate of this graph represents velocity in meters /
second. The horizontal coordinate represents clock time in seconds.
So the average 'graph altitude' represents the average velocity in meters /
second, and the base of the trapezoid represents the change in clock time in seconds.
Average velocity is average rate of change of position with respect to
clock time, which is (change in position) / (change in clock time). When
average velocity is multiplied by change in clock time we get
average velocity * change in clock time = (change in position) / (change in
clock time) * (change in clock time) = change in position.
In terms of just the symbols v0, vf
and `dt:
What expression represents the rise? &$&$ Vf-Vo
What expression represents the run? &$&$ ‘dt
What expression therefore represents the slope? &$&$
Vf+Vo/2
The slope is rise / run. You correctly identified the rise as vf - v0, and the run by `dt.
However your result (vf + v0) / 2 is
not what you get when you divide your rise by your run.
What expression represents the width of the equal-area
rectangle? &$&$ ‘dt
What expression represents the altitude of the equal-area
rectangle? &$&$ Vo
vo is one of the two 'graph altitudes' of the
trapezoid. The equal-area rectangle has an altitude which is halfway between
the two 'graph altitudes'.
The two widths are v0 and vf.
What quantity is halfway between v0 and vf?
(review how the number halfway between 5 and 13 was obtained in the preceding
example).
What expression therefore represents the area of the
trapezoid? &$&$ Vo*’dt
The 'graph width' is `dt. If the altitude of the
equal-area rectangle was v0, then the area would indeed by v0 * `dt. Howevr the altitude of that
rectangle is not v0.
What is the altitude of the equal-area rectangle, and what therefore is its
area?
What is the meaning of the slope? &$&$ How step the
trapezoid is
The meaning is interpreted in terms of the situation.
What is the meaning of the rise? Is it the average velocity, the average
clock time, the change in velocity, the change in clock time, the initial
velocity, the initial clock time, the final velocity, the final clock time,
etc.?
What is the meaning of the run? Is it the average velocity, the average
clock time, the change in velocity, the change in clock time, the initial
velocity, the initial clock time, the final velocity, the final clock time,
etc.?
What therefore is the meaning of the slope, which is obtained by dividing
the rise by the run?
What is the meaning of the area? &$&$ how much space
is in the trapezoid
The area is the product of the base and the altitude of the equal-area
rectangle.
How was the altitude of this rectangle obtained, and what does it therefore
represent in terms of the motion?
What is the base of the rectangle and what does it therefore represent in
terms of the motion?
If the ball on the ramp changes its velocity from v0 to vf during time interval `dt, then
If you have numbers for v0, vf and
`dt how would you use them to find the following:
the change in velocity on this interval &$&$ Vf-Vo
the change in clock time on this interval &$&$ ‘dt
the average velocity on this interval, assuming a
straight-line v vs. t graph &$&$
your answers to the two questions before this and the question after this
are correct, but you didn't answer this question
the average acceleration on this interval &$&$ Vf-Vo/’dt
the change in position on this interval &$&$ vf-vo/2
vf and v0 are velocities.
When you subtract two velocities you get a velocity.
When you divide a velocity by 2 you get a velocity which is half as great.
So when you subtract two velocities and divide by 2 you get a velocity.
A velocity is found by calculating (change in position) / (change in clock
time). So a velocity can't be a position or a change in position.
To get change in position, you could multiply (change in position) /
(change in clock time) by (change in clock time), which is the same as
multiplying an average velocity by an change in clock
time.
What are the average velocity and the change in clock time, and what
therefore do we get when we multiply the average velocity by the change in
clock time?
In terms of the symbols for v0, vf
and `dt, what are the symbolic expressions for each
of the following:
the change in velocity on this interval &$&$ Vf-Vo
the change in clock time on this interval &$&$ Vf
the average velocity on this interval, assuming a
straight-line v vs. t graph &$&$ v0-vf
This is the change in velocity, not the average velocity.
the average acceleration on this interval &$&$ V0/Vf
Average acceleration is (change in velocity) / (change in clock time). You
can't get an acceleration by dividing one velocity by
another.
What is the expression for change in velocity?
What is the expression for change in clock time?
What therefore is the expression for average acceleration?
the change in position on this interval &$&$ Graph
Area, vf+vo/2
The graph area requires that you multiply average 'graph altitude' by the
base. (vf + v0) / 2 is part of the correct answer.
What is the missing part, and what therefore is the result?
How are your answers to the above questions related to the
v0, vf, `dt trapezoid?
&$&$ V0, initial velocity, VF final velocity, ‘dt,
time it takes
If v0 = 50 cm / sec and vf = 20 cm
/ sec, and the area of the trapezoid is 140 cm, then
What is the rise of the trapezoid and what does it
represent? &$&$ 50/2=2.5
What are the two 'graph altitudes'?
How do you use the 'graph altitudes' to get the rise?
What therefore is the rise of this trapezoid?
What is the altitude of the equal-area rectangle?
&$&$ Vf-Vo
The altitude of the equal-area rectangle is halfway between the two
altitudes.
The two altitudes are v0 = 50 cm/s and vf = 20
cm/s.
What is halfway between these two quantities?
Can you use one of your answers, with the given area, to
determine the base of the trapezoid? &$&$ Yes.
'Yes' and 'no' are both wrong answers to any question, if they are
unsupported. You need to say why the answer is 'yes'.
Can you now find the slope of the trapezoid? &$&$
Yes. Vf/vo
vf is not the rise and v0 is not the run, so vf / v0 is not the slope.
The 'run' is the base. You have to figure out the base in order to figure
out the slope.
This is a challenging question, and most students won't get it on the first
try. See if you can first correct as many of your original answers as
necessary. Then spend a reasonable amount of time trying to answer these last
two questions, but don't let yourself get bogged down on this one.
Lego toy car:
As shown in class on 090831, a toy car which moves through
displacement 30 cm in 1.2 seconds, ending up at rest at the end of this time
interval, has an average rate of change of position with respect to clock time
of 25 cm / s, and by the definition of average velocity, this is its average
velocity. If its v vs. t graph is a straight line, we conclude that its
velocity changes from 50 cm/s to 0 cm/s during the 1.2 seconds, and the average
rate of change of its velocity with respect to clock time is therefore about
-41.7 cm/s.
The same toy car, given an initial push in the opposite
direction, moves through displacement -60 cm in 1.5 seconds as it comes to
rest. If you previously submitted the correct solution to this situation you
found that the acceleration of this car was + 53.3 cm/s^2, approx..
If you didn't get this result, then you should answer the following questions
(if you got -53.3 cm/s^2 and know what you did wrong to get the negative sign,
you can just explain that): &$&$
Using the definitions of average velocity and average rate
of change, determine the average velocity of the car during this interval.
Explain completely how you got your results. &$&$ To get average rate
of change you divide 30/1.2 which equals 1.2seconds. And the average rate of
change of its velocity with respect to clock time is -41.7 50/1.2
'This interval' refers to the interval on which the displacement is -60 cm
and the change in clock time is 1.5 seconds.
Your answer to this and the following two questions applies to the interval
on which the car moves 30 cm in 1.2 seconds. You were given the reasoning used
to analyze this interval, and can analyze the present interval by imitating
that reasoning.
Describe your graph of velocity vs. clock time for this
interval, give the altitudes of the corresponding v vs. t trapezoid and verify
that the average altitude of this trapezoid is equal to the average velocity
you obtained in the preceding step. &$&$ my graph of velocity vs. clock
time is that its is going in a negative direction with
the like going \. Because altitude represents velocity
Your description should include the two altitudes and the width of the
trapezoid, as well as its slope and area. You should specificy
the two altitudes and the width, then explain how you use them to get the slope
and area.
What is the car's initial velocity,
its final velocity, and the change in its velocity on this interval?
&$&$ 30, 0, 1.2
What therefore is its acceleration on this interval?
&$&$ -41.7
Vertical rotating strap, ball on incline with magnets:
You are asked here to speculate on and think about the
behavior of a couple of fairly complicated systems. These systems are complex
enough that you could easily get carried away and spend weeks on your answers.
Unless you just can't help yourself, limit yourself to 1/2 hour, or 1 hour at
the most. You might spread that out over a few days to let you brain
subconsciously sort out these ideas:
The rotating-strap system with the magnets is attracted to
the straps on the table. At some points of its rotation the magnetic force
exerted by the straps on the magnets tends to speed the system up, at other
points it tends to slow the system. Obviously you aren't yet expected to know
how to analyze this system (and a complete analysis is beyond the scope of
first-year physics), but there are things about this system we will be able to
reason out with the ideas we will be developing over the next few weeks. Just
to get the process started, give me your best answers on to the following
questions:
Describe in words how the system is oriented when the
magnetic force acting on it is speeding it up. &$&$ Well the force is
trying to connect to magnetic so it is speeding up.
Describe in words how the system is oriented when the
magnetic force acting on it is slowing it down. &$&$ the slow down has
a greater effect because the closer to the magnetic force it will slow it down.
At what position do you think the magnetic force is speeding
it up the most? How could we experimentally test whether this is the case or
not? &$&$ Well the closer you have it the slow down has a greater
effect so it would only make since the further away it would speed it up.
At some points the magnetic interaction speeds the system
up, and at some points it slows the system down. Which do you think has the
greater effect? That is, do you think net effect of the presence of the
magnetic force is to speed the system up or to slow it down? &$&$ The
slow down has a greater effect because when observing you can actually see the
slow down happen and I had to have someone point up the speed up part.
Do you think the net effect of the magnetic force is to
increase or decrease the frequency of the oscillation? &$&$ I would say
they both cancel each other out because you have and equal negative and
positive effect. If you had the slowdown end up higher it would increase the
number of oscillations, or if you had the faster part higher then it would
decrease oscillations, it just depends on how you have the magnet.
Is it possible that the magnetic force slows the system down
but increases its frequency of oscillation? &$&$ Yes. Because the slow
down process may be something you cant even point out.
Does the system act like a pendulum in that the time
required for a cycle is pretty much constant? How would we test this? What
might we expect to find? &$&$
Comment also on what you think happens as the ball on the
incline interacts with the magnet, and how we might test some of your ideas.
&$&$ yes it does act like a pendulum. Test it with a pendulum, that the
time required is either constant or not. If the ball interacts with the magnet
on a incline it looks like it would slow it down
because you are going against gravity, you could test it using a pendulum and
see how many oscillations its takes.