Class Notes 100901
Go to the link Introduction to Key Systems and do as instructed. You should view the key systems, as indicated. However the very last form in that exercise, entitled Responses to Questions about Key Systems, will be assigned later after we have discussed it in class.
Then do the following:
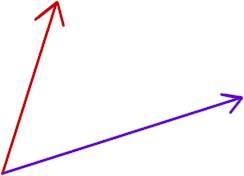
The figure below depicts two vectors. Let A be the red vector and B the purple vector (the purple vector is more horizontal than vertical, the red vector more vertical than horizontal). Both vectors share a common initial point.

We wish to project vector A onto vector B. To do so we sketch a projection line from the tip of A down to the vector B, meeting B at a right angle. The figure below shows the projection line (in sort of a sick green color).
The point where the projection line meets the B vector will be called the projection point.
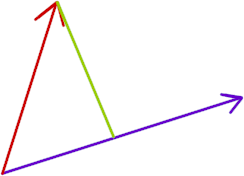
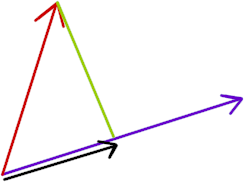
The projection of vector A on vector B is the vector whose initial point is the same as the initial point common to A and B, and whose terminal point is the projection point. The projection vector is depicted in the picture below, but displaced slightly so it can be easily distinguished from the B vector.
In the figure below the green line clearly does not meet the B vector at a 90 degree angle, so it is not a projection line.
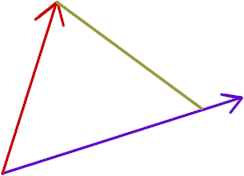
Estimate the angle between the green line and the B vector. How many degrees is the angle, as you estimate it? Give you estimate in the next line.
****
#$&*
We can also project the B vector onto the A vector. One of the three figures below shows a reasonably good projection line. Which figure is it? What is wrong with the other figures?
****
#$&*
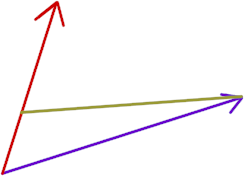
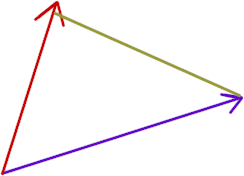
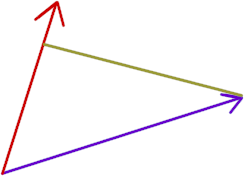
If vector A has length 10 units and vector B length 12 units, then how long is the vector representing the projection of A on B? How long is the vector representing the projection of B on A? Give your best estimates in the first line below, giving two numbers separated by commas:
****
#$&*
Trapezoidal Region of v vs. t graph
The figure below depicts a horizontal axis and two points (2, 5) and (6, 8). The vertical axis is not shown.
The vertical axis represents velocity in cm / sec. The horizontal axis represents clock time in seconds. So the point (2, 5) represents a velocity of 5 cm/s at clock time t = 2 sec, and the point (6, 8) represents a velocity of 8 cm/s at clock time t = 6 sec.
The two points are understood to represent an interval in the motion of some object.
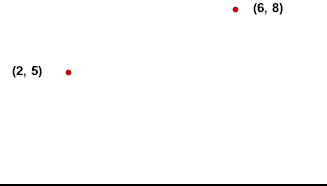
The next figure includes a straight line between the two points.
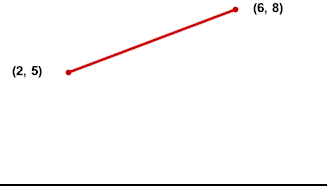
To move from the point (2, 5) to the point (6, 8) on the graph we could move 3 units upward, then 4 units to the right. The vertical change in graph coordinates is called the 'rise', the horizontal change the 'run', from the first point to the second.
These quantities are depicted in the figure below:
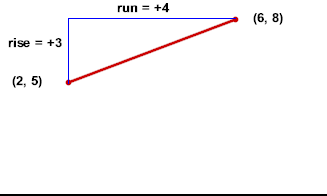
The rise, being a change in the vertical coordinate, represents the 3 cm/s change in velocity during the corresponding interval. The run, being a change in the horizontal coordinate, represents the 4 second change in the clock time.
The slope of the segment connecting the two points therefore represents
which can be used as a measure of how quickly, on the average, velocity is changing during this interval. Not only does the slope tell us how quickly the velocity is changing, it tells us the sign of the change, which indicates whether the velocity is increasing or decreasing (note that if the second point was lower than the first the sign of the slope would be negative, and the velocity would be decreasing).
In fact the slope, in representing change in velocity / change in clock time, represents the average rate of rate of change of velocity with respect to clock time (be sure you go back to the definition of average rate of change and see how this is so).
We can therefore enhance our picture by indicating the slope. Knowing that the graph is of velocity in cm/s vs. clock time in s, we know that the units of the slope are cm/s^2.
The figure below also adds two vertical line segments, one projected from each point to the horizontal axis. Next to each new segment we indicate its length.
We will find the area of the resulting trapezoid and interpret that area.
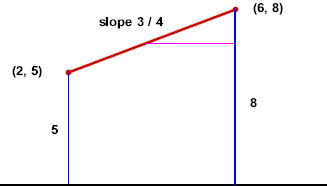
If we make a horizontal 'cut' starting at the midpoint of our segment, we will trim off a triangle:
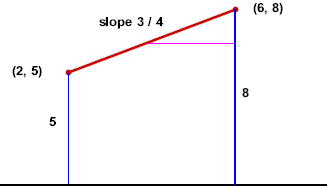
That triangle could be rotated 180 degrees and pasted on the left-hand side of the figure, as indicated below:
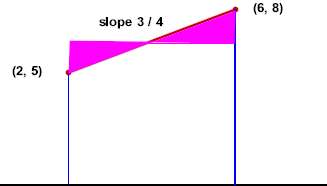
This shows that the area of the original trapezoid is equal to that of the rectangle indicated in the next figure.
It should be clear that the midpoint of the segment occurred halfway between vertical coordinate 5 and vertical coordinate 8, at vertical coordinate 6.5.
The height of the rectangle is therefore 6.5, representing an average velocity of 6.5 cm / second.
In the figure below we indicate the height 6.5 and width 4 of the rectangle. The height represents the average velocity 6.5 cm/s, the width represents the change in clock time, 4 seconds.
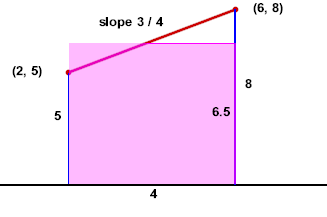
The area of the rectangle, and hence the area of the trapezoid, therefore represents the product
of the average velocity and the change in clock time during the interval.
Since the product of average velocity and change in clock time is the change in position, or displacement, of the corresponding object, we conclude that the area of our trapezoid does in fact represent the displacement of the object, provided only that the straight line segment accurately represents its velocity during the interval. If that is the case, then since the slope of a straight line is unchanging (and since, as we have seen, the slope of this graph represents the acceleration of the object), it is easy to see that the velocity is changing at a constant rate provided the acceleration, i.e., the rate of change of the velocity with respect to clock time, is constant.
Our conclusion:
For a straight-line velocity vs. clock time graph representing the motion of an object during some interval:
The Equations of Uniformly Accelerated Motion
More generally, let us represent the initial and final velocities by the symbols v_0 and v_f, and the time interval by `dt:
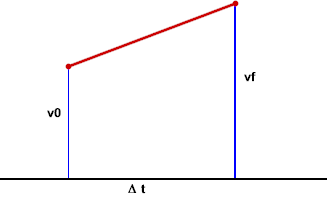
The rise between our two points is from v_0 to v_f, a rise of (vf - v0). The 'run' is the width `dt of the trapezoid, so the slope is
The vertical coordinate of the midpoint is halfway between v0 and vf, so our 'equal-area rectangle' will have height (v0 + vf) / 2, which is the average of the initial and final velocities. Its width is `dt, so its area is
The slope represents the acceleration of the corresponding object, and the area represents its displacement, so using a for the acceleration and `ds for the displacement we can write
and
These equations apply as long as the straight line segment accurately represents the motion of the object during the interval.
These equations involve five quantities: v0, vf, a, `ds and `dt.
These equations should not prevent us from directly reasoning out as much of the solution as possible, using the seven quantities vf, v0, vAve, `dv, a, `dt and `ds and the definitions of average velocity and acceleration.
Most combinations of three of the five variables can be reasoned out without resorting to either of these equations. Only two combinations (namely, (v0, a `ds) and (vf, a, `ds)) cannot be directly reasoned out using the definitions. In those cases, we would require several steps to solve the two simultaneous equations. We can take care of that complication now so we don't have to worry about it later:
We will be doing the algebra during the next class, and we will be writing these steps out using standard notation. For reference I'm including it here:
We can pretty easily eliminate vf from the two equations:
The equation vf = v0 + a `dt gives us an expression to substitute for vf in the equation `ds = (vf + v0) / 2 * `dt. We get
`ds = ( (v0 + a `dt) + v0 ) / 2 * `dt. Simplifying the numerator (v0 + a `dt) + v0 we get
`ds = ( 2 v0 + a `dt) / 2 * `dt. Dividing the numerator by 2, being sure to use the distributive law, we obtain
`ds = ( (2 v0) / 2 + a `dt / 2) * `dt = (v0 + 1/2 a `dt) * `dt. Multiplying through by `dt we get
`ds = v0 `dt + 1/2 a `dt^2. We will refer to this as the third equation of uniformly accelerated motion.
We can eliminate `dt from the two equations.
We solve the first for `dt:
a = (vf - v0) / `dt so
`dt = (vf - v0) / a.
We now substitute this expression for `dt in the second equation `ds = (v0 + vf) / 2 * `dt. We obtain
`ds = (v0 + vf) / 2 * (vf - v0) / a.
The right-hand side can be written (vf + v0) ( vf - v0) / (2 a). Since (vf - v0) ( vf + v0) = vf^2 - v0^2, our equation becomes
`ds = (vf^2 - v0^2) / (2 a).
We could leave the equation as it is, but you will see later that there is good reason to rearrange it as follows:
Multiply both sides by 2 a to get
2 a `ds = vf^2 - v0^2.
Then solve for vf^2, obtaining
- vf^2 = v0^2 - 2 a `ds.
We will refer to this as the fourth equation of uniformly accelerated motion.
Our v vs. t trapezoid therefore gives us four equations that apply to uniformly accelerated motion:
For University Physics students
Problem:
2 balls roll down 2 different ramps, the first accelerating 30 cm from rest in 3 second, the second 25 cm from rest in 2 seconds Both start at the same x coordinate.
At what x coordinate should the first ball be started in order to match the x position of the second, at the instant it reaches the 25 cm mark?
Discussion:
We clearly have enough information to reason out the accelerations, without having to resort to equations.
We can assume that the second ball starts from x position zero.
The quantity we need to find is the initial position of the first ball.
We have at least two possible strategies for solving this problem:
Solutions:
First we go ahead and find the accelerations. The first ball averages 10 cm/s. Since it starts from rest its final velocity is 20 cm/s, and is therefore equal to the change in its velocity. A velocity change of 20 cm/s in 3 s implies an acceleration of 6.67 cm/s^2. Reasoning similarly we find that the acceleration of the second ball is 12.5 cm/s^2.
Now applying the first strategy:
In 2 seconds, the second ball, having been released from rest, will attain velocity (6.67 cm/s) * 2 s = 13.3 cm/s. Its average velocity will therefore be (13.3 cm/s + 0 cm/s) / 2 = 6.67 cm/s. (I've taken a little liberty here with significant figures and rounding). So its position will change by 6.67 cm/s * 2 s = 13.3 cm during the 2 seconds.
If we want it to end up at the 25 cm position after 2 seconds, we should therefore start it at position x0 = (25 cm - 13.3 cm) = 12.7 cm.
Note that we were able to reason everything out without the use of the equations.
Applying the second strategy:
The equation of motion for the first ball, assuming initial position x0_1, will be
x_1 (t) = x0_1 + v0 t + 1/2 a t^2,
where v0 = 0 and a = 6.67 cm/s^2. Thus we obtain
x_1(t) = x0_1 + 1/2 * 6.67 cm/s^2 * t^2 or
x_1(t) = x0_1 + 3.33 cm/s^2 * t^2.
The equation of motion for the second ball, which we assume starts at position 0, will be
x_2(t) = 1/2 * 12.5 cm/s^2 * t^2 = 6.25 cm/s^2 * t^2.
Our condition is that after 2 seconds, both balls will be at position x = 25 cm. Applying this to the motion of the second ball we get
x_2(2 sec) = 6.25 cm/s^2 * t^2 = 6.25 cm/s^2 * (2 sec)^2 = 25 cm.
This is actually nothing new. We already knew that the position would have to be 25 cm.
Our condition for the first ball is x_1( 2 sec ) = 25 cm. At t = 2 sec, our equation for x1 tells us that x_1(2 sec) = x0_1 + 3.33 cm/s^2 * (2 sec)^2, so that
25 cm = x0_1 + 3.33 cm/s^2 * (2 sec)^2 , or
25 cm = x0_1 + 13.3 cm. We easily solve for x0_1, obtaining x0_1 = 12.7 cm.
Thus, just as we found before, we start the first ball at the 12.7 cm position.
Now we will generalize the solution by solving the problem in symbols.
The position functions for the two balls can be written
x_1(t) = x0_1 + v0_1 * t + 1/2 a_1 t^2
x_2(t) = x0_2 + v0_2 * t + 1/2 a_2 t^2
For this problem both v0_1 and v0_2 are zero, since both balls start from rest. We will also assume, as before, that x0_2 = 0. Our equations become
x_1(t) = x0_1 + 1/2 a_1 t^2
x_2(t) = 1/2 a_2 t^2
The two positions will be equal at clock time t if
x_1(t) = x_2(t), or
x0_1 + 1/2 a_1 t^2 = 1/2 a_2 t^2.
If we subtract 1/2 a_1 t^2 from both sides, and factor out t^2, we get
x0_1 = 1/2 (a_2 - a_1) t^2
From this we see something we wouldn't have been likely to see from our previous solutions. Note that 1/2 a t^2 is the displacement of an object which starts from rest and accelerates at rate a for t seconds. Our expression above tells us that the initial position x0_1 of the first ball is equal to the displacement of an object which is released from rest, and accelerates for t seconds with an acceleration equal to the difference of the accelerations of the two balls.
Applied specifically to this case, the balls should be at the same position after 2 seconds, so
- x0_1 = 1/2 ( 12.5 cm/s^2 - 6.67 cm/s^2) * (2 s)^2 = 12.7 cm.
Now see if you can adapt the above analysis to determine where and when the two balls would be at the same x position, assuming that the first ball is initially moving at 10 cm/s, while the second is released from rest. See if you can reason it out directly. Then see if you can reason it out by substituting the given quantities into the equations for x_1(t) and x_2(t). Finally do a purely symbolic solution and see if you can interpret it.
Then answer the question of when the two balls will be moving at the same speed, and how far apart they will be at that instant.
Bring your solutions, or your best attempts at solutions, to class. We will be discussing this situation, and I'll expect everyone to be prepared to contribute.
1. On a coordinate plane sketch the points (5, 9) and (12, 3). You don't need to take a lot of time to meticulously mark off the scale or measure the points with a ruler, just make a reasonable estimate. You should be able to locate the origin and the two points in just a minute or so. Sketch a vector from the origin to the first point and call this vector B. Sketch another vector from the origin to the second point and call it A.
Sketch the projection of the A vector on the B vector, as we did in class. In case you need more detailed instructions:
Estimate the coordinates of the tip of the projection vector and give them in the next line:
****
#$&*
What therefore is the length of the projection vector? Give the length and explain how you found it starting in the next line:
****
#$&*
2. Repeat the above exercise using the points (4, 2) and (8, 3). You might have to extend the line of the B vector so that the projection line will meet it. Give your results starting in the next line:
****
#$&*
3. On a graph of velocity vs. clock time, with velocity in cm/s when clock time is in seconds, what does the point (3, 9) represent?
****
#$&*
On this graph of velocity vs. clock time the points (3, 9) and (6, 13) represent the velocities of a moving object at the corresponding clock times. What does the 'rise' between these points represent? What does the 'run' represent? What does the slope of the straight line between (3, 9) and (6, 13) therefore represent?
****
#$&*
If you cut a triangle from this trapezoid, cutting in the horizontal direction starting at the midpoint of the line segment between the two given points, you can simply rotate this triangle 180 degrees and join it to the remaining part of the trapezoid and form a rectangle.
****
#$&*
4. On a graph of velocity vs. clock time the points (t_0, v_0) and (t_f, v_f) represent the velocity and position of an object at the beginning and the end of some interval. The vertical lines from these points to the horizontal axis form what we will call the 'graph altitudes' of a trapezoid. The line segment from the first point to the second forms another side of the trapezoid, and the segment from t_0 to t_f on the horizontal axis forms the fourth side, which we call the 'graph width/ of the trapezoid. (in correct geometrical language this In terms of the symbols t_0, v_0, t_f and v_f, what are the following:
The average velocity v_Ave.****
#$&*
The change in velocity `dv.****
#$&*
The time interval `dt.****
#$&*
The displacement `ds.****
#$&*
The average rate of change of velocity with respect to clock time.****
#$&*
The average acceleration.****
#$&*
5. For your data in the rubber band experiment, give the endpoints of each rubber band in the first trial, where the rubber bands were just barely beginning to exert a tension force. Report one rubber band in each of the next three lines, giving in each line the x and y coordinates of the first point, followed by the x and y coordinates of the second point, in that order. Separate each number from the next by a comma. You will have four numbers in each of three lines, separated by commas. In the fourth line give the units of your measurements. Start in the next line:
****
#$&*
Find the lengths of the three rubber bands, based on the coordinates of the points you reported. Give the lengths in the first line below, separated by commas. Starting in the next line explain how you calculated the lengths:
****
#$&*
Now report the coordinates of the points you observed in the second trial, using the same format as before. Report the three different rubber bands in the same order as before:
****
#$&*
Report the lengths of the three rubber bands, using the same order as before:
****
#$&*
Assuming that each rubber band exerts a force of .5 N for every centimeter of length in excess of its 'barely-exerting-a-force' length, what are the three forces? Report the three forces, separated by commas, in the first line below. In the second line below, explain how you determined your forces.
****
#$&*
Everyone should be able to do the above. At some point below I would expect most College Physics students to get a little lost, so if you are a College Physics student and do get lost, it's OK. We'll go through some further explanation based on the above and you'll be able to answer the questions after the next class.
For your second trial, each rubber band can be represented by a displacement vector, a vector from one of its endpoints to the other. More specifically we will represent each rubber band by the displacement vector from the point closest to the middle to the point furthest from the middle (the middle is the center of that paperclip on which all three rubber bands are pulling).
In the first line below, report the x and y components of the vector representing the first rubber band, using the notation <x comp, y comp>. For example a vector with x and y components 3 cm and -7 cm would be reported as <3 cm, -7 cm>. In the second and third lines, report the components of the vectors representing the second and third rubber bands. Report the rubber bands in the same order as before. Starting in the fourth line give a brief explanation of how you got your results:
****
#$&*
The vectors you reported above are displacement vectors. It should be clear that the magnitude of each is the length of the corresponding rubber band. If you divide both components of a displacement vector by its length, you will get a unit vector which represents the direction of the displacement vector. In the first three lines below, give the x and y components of the three resulting unit vectors. Starting in the fourth line give a brief description of how you obtained your results and what they mean.
****
#$&*
If you now multiply the unit vector for each rubber band by the force it exerts, you get the force vector for the force exerted on the 'middle' paperclip by that rubber band. Do this and report your force vectors below, one to each line, reporting the forces of the three rubber bands in the same order as before. Starting in the fourth line give a brief description of how you obtained your results and what they mean.
****
#$&*
Sketch your force vectors, using an appropriate scale. You should select a scale such that your sketch takes up at least half of a sheet of paper.
Give the lengths of your projections in the first line, separated by a comma. In the second line give the length of the vector you picked.
****
#$&*
In the first line below give the forces corresponding to your projections, based on the scale of your sketch. In the second line give the force of the vector you picked previously. In the third line explain how you got the forces from the measured lengths:
****
#$&*
University Physics Students only: Find the magnitude of the projection of each of the force vectors on each of the others, based on the coordinates of the force vectors. (You will use the dot product, as explained in Chapter 1 of your text. If you're in multivariable calculus you'll be familiar with this. If you're not in that course, you might have some questions about this, but take my word for it, it's easy with just a little practice. So if you don't understand it from the text, ask. The magnitude of the projection of vector A on vector B is just the || A || cos(theta), where theta is the angle between the two vectors. Using the dot product it's easy to see that this is just the magnitude of A dot B / || B || ). Using the order in which you have been reporting the three rubber bands, give the projection of the first on the second, the first on the third, the second on the first, the second on the third, the third on the first and the third on the second. In the fourth line give the details of one of your calculations, selecting one that represents the general process:
****
#$&*
6. (University Physics Students only). As requested above:
See if you can adapt the analysis to determine where and when the two balls would be at the same x position, assuming that the first ball is initially moving at 10 cm/s, while the second is released from rest. See if you can reason it out directly. Then see if you can reason it out by substituting the given quantities into the equations for x_1(t) and x_2(t). Finally do a purely symbolic solution and see if you can interpret it.
Then answer the question of when the two balls will be moving at the same speed, and how far apart they will be at that instant.
Give a brief synopsis of your approach:
****
#$&*