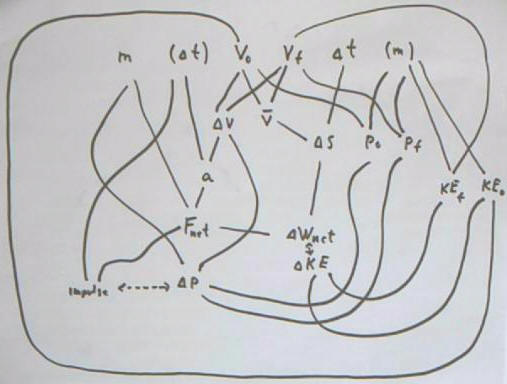
The figure below indicates how various quantities `dt, v0, vf, `dv, vAve, `ds, a related to uniform acceleration on an interval, and the additional quantities Fnet, p0, pf, impulse, `dp, `dW_net, KE0, KEf, `dKE obtained as a direct result of Newton's Second and Third Laws, can be paired to reason out other quantities.
Every quantity in this diagram can be found based on at least one other pair of quantities, using a few basic definitions and theorems:
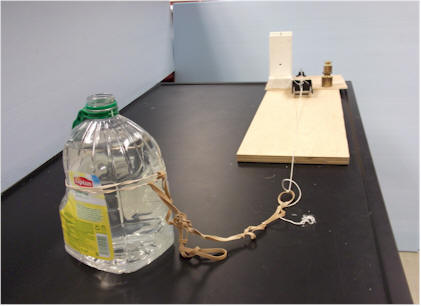
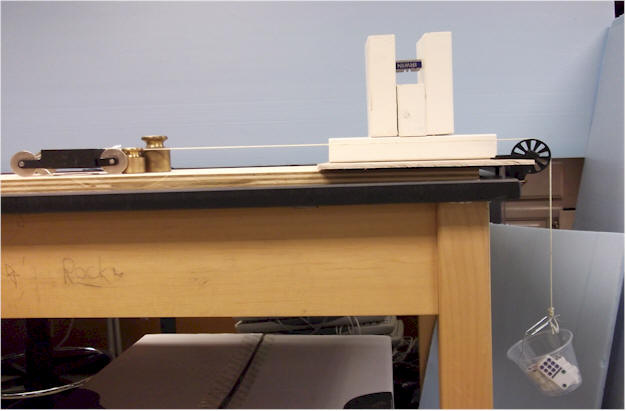
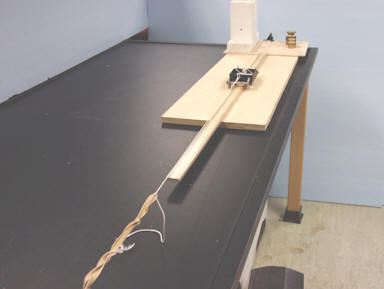
A cart is attached by one string to a rubber band chain at left, and by another to a suspended mass over a pulley.
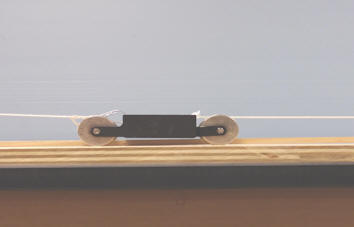
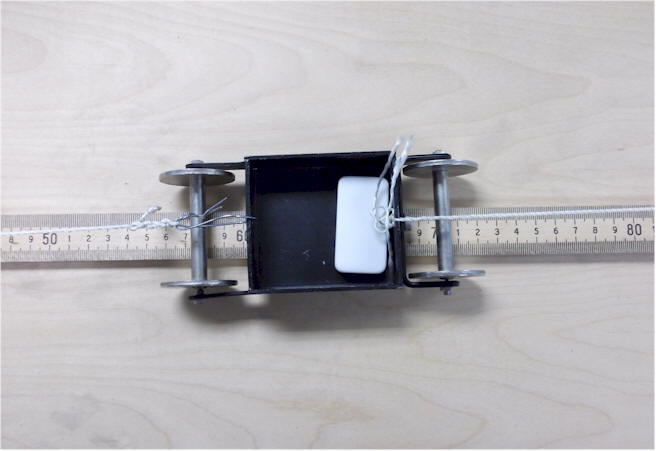
Between cart position 63 cm and 73 cm there is no significant tension in the rubber band (some tension is required to support the weight of the rubber band; for the moment this will be ignored).
The rubber band chain begins exerting tension at the 73 cm length, with tension increasing by about .3 Newtons for every centimeter beyond this position.
At the 80 cm position the system is in equilibrium.
If the cart is released from the 63 cm position it comes to rest for an instant at the 86 cm position, before being accelerated back toward the rubber band.
The coefficient of rolling friction is between .01 and .02, and will for the moment be considered negligible.
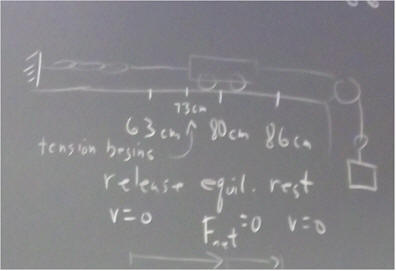
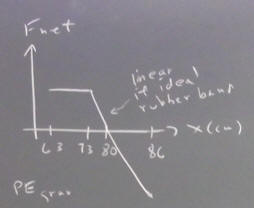
Between the 63 cm and 73 cm positions, tension on the left is negligible so the net force on the system is the constant gravitational force on the suspended mass.
Between the 73 and 80 cm positions, tension on the left increases linearly while gravitational force on the suspended mass remains constant, so the net force on the system decreases linearly to 0.
Between the 80 cm and 86 cm positions, tension on the left continues to increase linearly while gravitational force on the suspended mass remains constant, so the net force continues to decrease linearly into negative values.
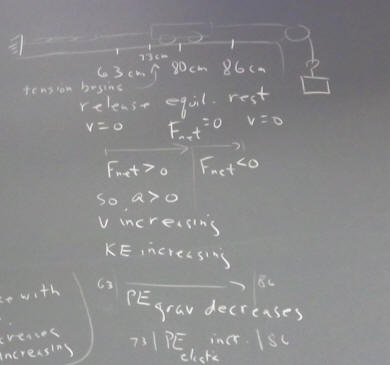
The class was asked to sketch graphs of F_net, PE_grav, PE_elastic and KE for a system released from rest at the 63 cm position, as it moves to the 86 cm position.
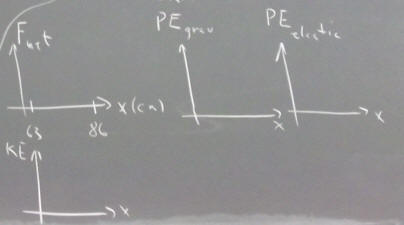
F_net is constant between the 63 and 73 cm position, being just equal to the weight of the suspended mass.
F_net then decreases linearly as the elastic force exerted by the rubber bands increases linearly in magnitude.
For an accurate sketch of the ideal F_net vs. x between these positions, the area between the graph and the x axis for the interval from 63 cm to 80 cm (this area is above the graph) should be equal to the area between the 80 cm and 86 cm positions (this area lies below the graph).
`q001. Answer the following:
What is the meaning of the area of a 'graph trapezoid' on a graph of F_net vs. x?
****
#$&*
For this ideal situation, why should the two areas therefore be equal?
****
#$&*
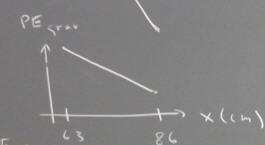
The gravitational PE of the system decreases as the suspended mass descends. It should be clear that since the gravitational force on this mass remains constant, every centimeter of descent corresponds to the same decrease in gravitational PE, and the graph is therefore linear.
The original value of the gravitational PE depends on the position with respect to which you have chosen to measure that PE. If you measure with respect to the floor, the original and final PE will both be positive, and the graph below might well represent this choice of reference position. Had you chosen to measure from the top of the table, the both values of the PE would be negative, and graph would have been below the x axis. However for any choice of reference position, the 'rise' between the two points would have been the same, since the change in PE does not depend on the reference point.
`q002. What does the slope of this graph represent?
****
#$&*
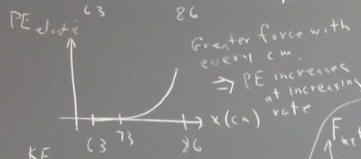
The elastic PE of the rubber band chain is originally zero. The chain is not stretched, and contains no PE.
The chain remains unstretched until the position of the cart reaches 73 cm, so the PE remains zero up to this point.
The chain then begins to stretch. With every centimeter its tension increases, to that each centimeter corresponds to a greater increase in elastic PE. The graph of PE vs. x therefore increases at an increasing rate, as indicated in the figure below.
`q003. Using the information given at the beginning, determine the elastic PE of the rubber band chain at the 80 cm and the 86 cm positions. Assume an ideal rubber band, whose force (unlike that of a real rubber band) is wholly conservative in nature.
****
#$&*
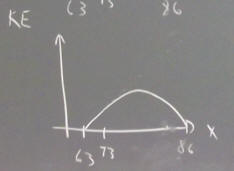
Between the 63 and 73 cm positions, the KE of the system will increase as its gravitational PE decreases. So the KE graph will for this interval be a straight line whose slope is equal but opposite to that of the graph of gravitational PE vs. x.
Beyond the 73 cm position the elastic PE of the system begins to increase, and continues to increase more and more quickly. The gravitational PE continues to decrease at a constant rate, at first decreasing more quickly than elastic PE increases. So the total PE will for a time continue to decrease, but as the elastic PE builds it does so more and more slowly, until at a certain point the elastic PE is increasing just as fast as the gravitational PE is decreasing. The elastic PE continues to increase at an increasing rate, so beyond this point the total PE begins to increase.
The total energy of the system remains constant (remember we're talking about the ideal case here). So as the PE of the system decreases, its KE increases. Then as the PE begins to increase, its KE decreases. So as the cart passes the 73 cm position, the KE of the system will continue to increase, but more and more slowly until it peaks at the point where the PE begins to increase. The
At first the elastic PE increases slowly and the gravitational PE decreases more quickly than the elastic PE increases. At some point the two rates are equal in magnitude, and beyond this point the elastic PE builds more quickly than the gravitational PE decreases. The graph of KE vs. x will therefore increase at a constant rate from the 63 to the 73 cm position (corresponding to the linear decrease in PE), then will continue to increase but at a decreasing rate (corresponding to the continuing but slowing decrease in PE) before peaking and beginning to decrease at an increasing rate (corresponding to the increasingly rapid increase in PE).
At the 86 cm point the system is at rest, so the KE will again be zero.
`q004. In your own words:
Clearly, beyond the 73 cm point the elastic PE increases. Why does it do so at an increasing rate?
****
#$&*
At what point does total PE stop decreasing and start increasing? Hint: think of how the F_net vs. x graph is related to the graph of the total PE.
****
#$&*
`q005. Using the information given at the beginning, which includes the force constant for the rubber band and the mass of the suspended weight, find the following (the F_net vs. x graph could also be helpful):
The change in gravitational PE between for the interval from 60 cm to 65 cm.
****
#$&*
The change in elastic PE for the interval from 60 cm to 65 cm.
****
#$&*
The change in gravitational PE and in elastic PE for the interval from 75 cm to 80 cm.
****
#$&*
The change in gravitational PE and in elastic PE for the interval from 80 cm to 85 cm.
****
#$&*
The change in KE for each of the three intervals given above:
****
#$&*
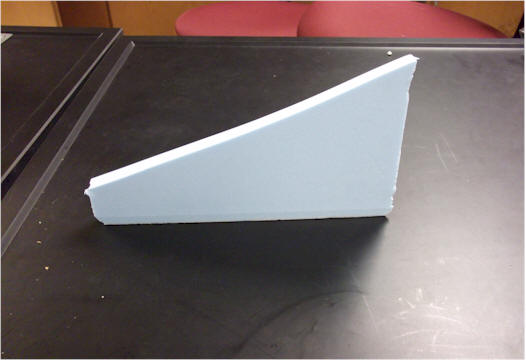
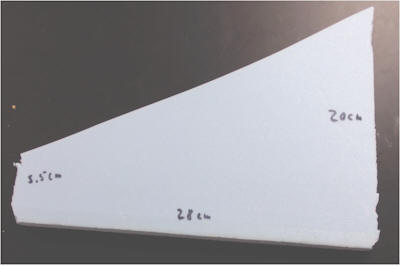
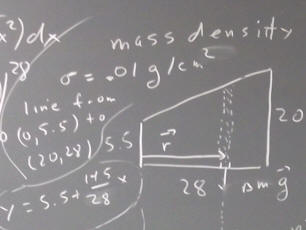
For a uniform rectangular sheet of foam, gravity acts on every particle in the foam. The influence of gravity is spread over the entire sheet.
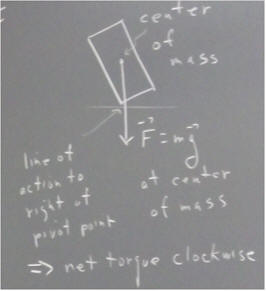
The center of mass is the point at which the sheet could theoretically be balanced. The balance would, however, be unstable and any small disturbance in the air, or any vibration of the system, would quickly destabilize it and it would quickly fall.
We have seen that by balancing the sheet (as nearly as possible) on a thin edge in two different directions, we can obtain two lines along which the sheet will balance. These lines, if accurately located, intersect at the single balancing point, i.e., at the center of mass.
The center of mass of a uniform rectangular sheet will lie at the center of that rectangle.
Suppose we try to balance the sheet on one of its corners. It will fall to one side or the other.
We can predict on which side it will fall. We simply locate the point 'directly below' its center of mass. Whichever side of the corner that point lies, the sheet will fall in that direction.
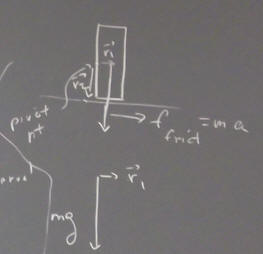
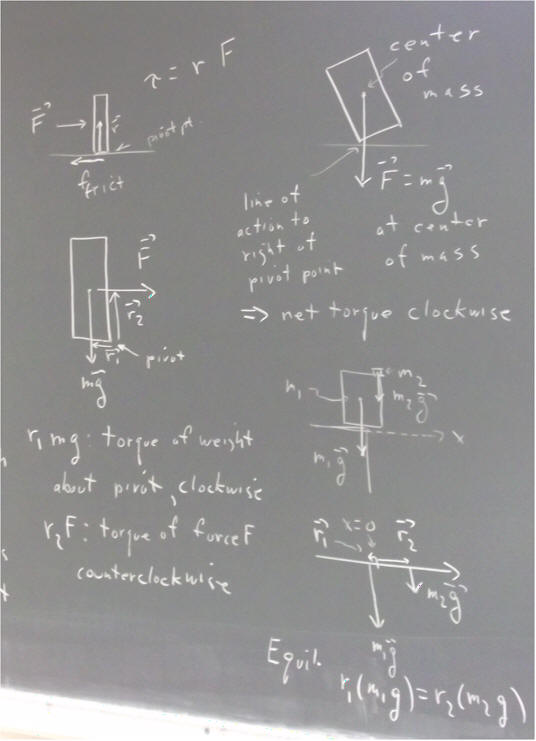
More formally we analyze the situation as follows:
In the figure below the line of the gravitational force passes to the right of the corner point. As a result the gravitational force exerts a 'torque', a sort of 'rotational force', tending to rotate the system in the clockwise direction.
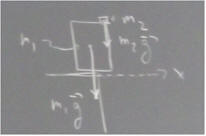
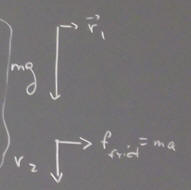
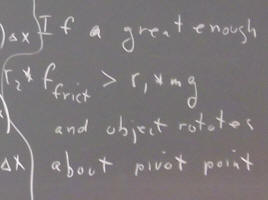
Now consider two objects, a larger object with mass m1 and a smaller object with mass m2. The larger part of m1 lies above a table but part overhangs the edge of the table. The mass m2 rests near the edge of m1 which overhangs the edge of the table. It's clear that if m2 is not present the object should remain on the tabletop, while if m2 is great enough the gravitational force will tend to rotate the system clockwise and it will fall off the table.
In terms of the above discussion:
rotational quantities, analogies, reasoning, equations
vertical circle
both: center of mass
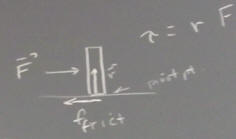
domino tipping: at what point would rb chain cause tipping?
algorithm: is PE increasing or decreasing?
labs need to be done
Motion in the Gravitational Field of the Earth.
algorithms:
Reason uniformly accelerated motion (7 quantities)
Use equations of motion (5 quantities)
Find net force given mass and kinematic quantities
Find acceleration given mass and net force
Derive work-energy theorem and impulse-momentum theorem
Analyze energy
Find components of a vector given magnitude and direction
Find magnitude of a vector given components
Find sum of vectors given components
Find sum of vectors given magnitudes and directions
Find net force for mass on incline
Find components of pendulum tension
Find centripetal acceleration given velocity and radius of circle
Find angular quantities given ...