Linear force function and work\energy
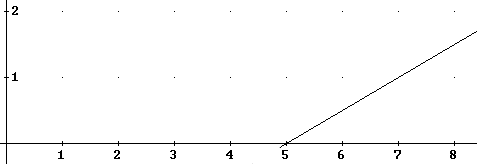
If the graph below indicates the tension in Newtons vs. length in cm for a rubber band:

At what length does the rubber band begin exerting a force?
****
#$&*
What is the average force exerted between the lengths x = 5 cm and x = 7 cm?
****
#$&*
As the rubber band is stretched from length 5 cm to length 7 cm, through what distance is the force exerted?
****
#$&*
How much work is therefore done in stretching the rubber band from 5 cm to 7 cm length?
****
#$&*
How much work is done in stretching the rubber band from the 5 cm length to the 8 cm length?
****
#$&*
How much work is done in stretching the rubber band from the 6 cm length to the 8 cm length?
****
#$&*
What are the areas beneath the graph between each of the following pairs of lengths:
****
#$&*
Verify that the equation of the straight line in the given graph is F(x) = (x - 5) * .5, where F(x) is force in Newtons when x is position in centimeters.
****
#$&*
University Physics Students: Confirm your results for graph areas by integrating the force function over appropriate intervals. Suggested method: Integrate the function symbolically from x = a to x = b, then use the resulting expression for appropriate values of a and b.
****
#$&*
Nonlinear force function and work\energy
(these questions are also included in the 'Problems' document)
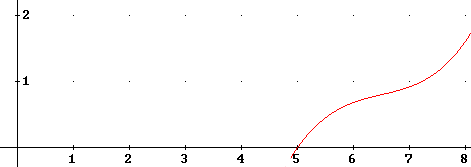
The graph given previously was linear. That graph would be realistic for a well-made spring, but not for a rubber band.
The graph given below is more realistic.

Estimate the average force exerted by this rubber band between the x = 5 cm and x = 6 cm lengths. Give your estimate in the first line, and explain how you made the estimate in the second:
****
#$&*
Repeat, for the x = 6 cm to x = 7 cm length interval.
****
#$&*
Repeat, for the x = 5 cm to x = 5.5 cm length interval.
****
#$&*
Repeat, for the x = 5.5 cm to x = 6 cm length interval.
****
#$&*
Estimate the work done in stretching the rubber band for each of these intervals. Give your four estimates in the first line below, separated by commas. Starting in the second line explain how you got your estimates:
****
#$&*
How much work do you estimate is done between the x = 5 cm length and the x = 7 cm length? Give your estimate in the first line, your explanation starting in the second.
****
#$&*
If a trapezoid was constructed by projecting the x = 5 and x = 7 points of the graph, what would be its area, and would this result be an overestimate or an underestimate of the actual area beneath the graph between these two points?
****
#$&*
If a trapezoid was constructed by projecting the x = 5 and x = 8 points of the graph, what would be its area, and would this result be an overestimate or an underestimate of the actual area beneath the graph between these two points?
****
#$&*
Directions of force and displacement vectors matter for work\energy
(These questions are also listed under the 'Problems' document)
If force F and displacement `ds are both along the x axis, then what is the sign of F * `ds in each of the following cases:
Give your answers in the given order, in the first line below, separated by commas. Starting in the second line explain how you got your results.
****
#$&*
If the x axis in the car-and-magnet experiment was your meter stick, then what were the directions of F and `dx, in each of the following situations:
Give your six answers in the first line below, separated by commas. Starting in the second line explain how you reasoned out your answers.
****
#$&*
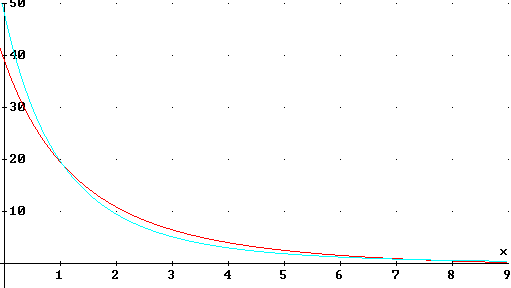
The figure below represents two plausible force vs. separation models for two of the ceramic magnets used in the experiment. Force is in Newtons while separation is in centimeters.

If the two magnets were touching before release, which model appears to predict the greater kinetic energy at the x = 2 cm position, and which at the x = 9 cm position?
****