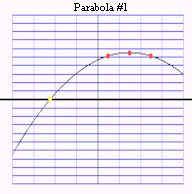
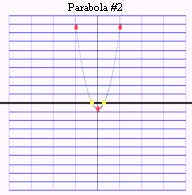
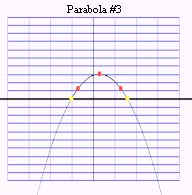
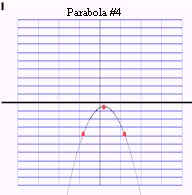
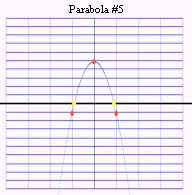
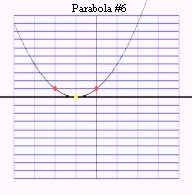
Graphs of Selected Parabolas
There are six graphs below, each of a different parabola. The
vertex, zers, and the points 1 unit to the right and to the left of the vertex are
indicated by dots. The scale is 1 unit per gridline in both the x and the y
directions.
You should be able to determine the equation of each parabola from its
graph.