Quiz 0309
A cube of a certain material 1 foot on a side weighs 235 lbs. What would be the weight of a cube of the same material which is 2 feet on a side?
As we saw previously it take 8 one-unit cubes to make a 2-unit cube. So we'll need 8 of the 235 lb cubes to make one of the new cubes. The total weight will be 8 * 235 lb = 1880 lb.
Graph y = x^-2 as follows:
We get the points (-1, 1), (1/2, 4), (1, 1) and (2, 1/4).
Doing the arithmetic we find that
As x -> 0 through positive x values the value of x^-2 approaches infinity.
x^-2 values will respectively be .01, .0001, .000001.
As x -> infinity the graph approaches the x axis as an asymptote.
Since the square of a negative number is equal to the square of its absolute value the graph to the left of the y axis will be a perfect reflection of the graph to the right.
We say that this graph is symmetric with respect to the y axis.
We start with the graph of y = x^-2 and vertically stretch by factor 2, then horizontally shift +3 units and vertically shift 1 unit.
The vertical stretch takes the basic points to (-1, 2), (1/2, 8), (1, 2) and (2, 1/2).
Then the horizontal shift takes everything 3 units to the right; among other things the vertical asymptote moves to the line x = 3.
Finally the vertical shift takes everything 1 unit higher, moving the horizontal asymptote from the x axis to the line y = 1.
The basic points all increase x coordinates by 3 and y coordinates by 1, giving us (2,3), (3 1/2, 9), (4, 3) and (5, 1 1/2).
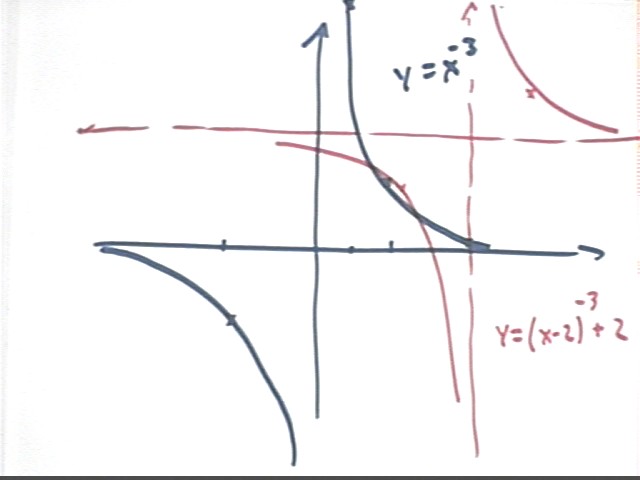
Repeat the preceding for y = x^-3.
The basic points will be (-1, -1), (1/2, 8), (1, 1), (2, 1/8). The graph in the first quadrant will look much like the graph of x^-2, but between x = 0 and x = 1 the graph will be higher and steeper, while to the right of x = 1 the graph will descend more rapidly toward the x axis.
Evaluating at .1, .01, .001, etc. shows us that the vertical asymptote is much steeper than for y = x^-2. Evaluating at x = 10, 100, 1000 etc. shows that the graph approaches the x axis much more quickly than that of y = x^-2.
The (-1, -1) point alerts us to the fact that x^-3 will take negative values to the left of the x axis; since we are taking an odd power of x, negative values of x will give us negative results.
This leads us to conclude that the graph to the left of the y axis is an 'upside down' reflection of the graph to the right, and also that every point to the left can be connected by a line through the origin to a corresponding point to the right, in such a way that f(-x) = - f(x). We say that the graph is symmetric with respect to the origin.
Construct the graph of y = (x-2)^-3 + 2
We construct the y = x^-3 graph as a basis for the desired graph.
The graph of y = (x-2)^-3 + 2 is shifted 2 units to the right and 2 units up. The easiest way to construct the resulting graph is to sketch x and y axes both shifted 2 units in the positive direction, then to shift the graph of y = x^-3 so that the resulting graph will have asymptotes at the 'new' set of axes.
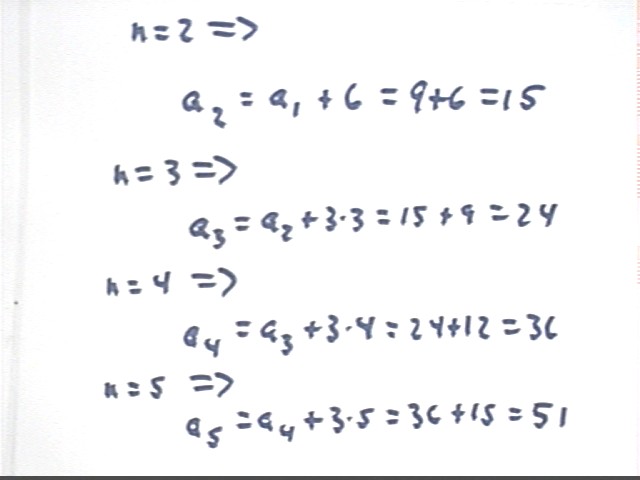
Now try the relation a(n) = a(n-1) + 3 n, a(1) = 9. Get the first few numbers, then try to predict a(3597).
We get sequence a(1), a(2), a(3), a(4), a(5), ... equal to
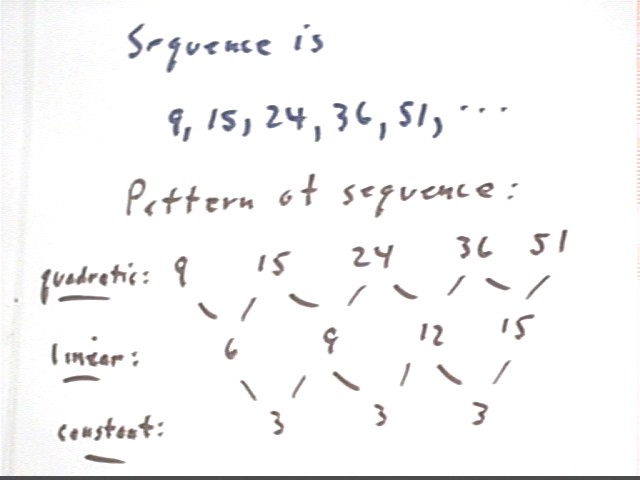
9 15 24 36 51 ...
The details are shown below, where we have used subscripts (e.g., a with subscript n) instead of function notation a(n):
Analysis of differences tell us that this sequence is quadratic.
So a(n) is a quadratic function of n. It follows that a(n) is of form y = a n^2 + b n + c, the the a in 'a(n)' refers to the function a and the a in front of n^2 refers to the constant a in the form of a quadratic function.
We can substitute any three 'data points' to get a, b and c.
Using the first three (n, a(n)) points (1,9), (2,15) and (3,24) we get equations:
These equations can be solved using the techniques developed in the first few classes. Solutions are a = 1.5, b = 1.5 and c = 6.
So a(n) = 1.5 n^2 + 1.5 n + 6.
We got the function so how do we find a(3597)?
Plug in n = 3597. We get
a(3597) = 19,413,015
There's another way to get this result, using simple arithmetic and common sense. See if you can figure it out.
Note that Precalculus I Class 02/25 from Spring 03 notes reviews the process of constructing a given quadratic by stretching and shifting the graph of y = x^2.
A single packet of salt poured onto the center of the 'target' below appears to have a diameter of about 2.25 units on the scale of the graph.
How many packets should it take to double the diameter of the pile to 4.5 cm?
The common answer given by students in class is 2, though some mentioned 3 or 4.
We obtained the following data:
|
radius |
# packs |
|
2.25 |
1 |
|
2.9 |
2 |
|
3.6 |
3 |
|
3.9 |
4 |
|
4.2 |
5 |
|
4.4 |
6 |
|
4.5 |
7 |
We conclude that it appears to take about 7 packs to double the radius of the pile. We note that the diameters of the piles, especially the smaller ones, do have a significant amount of uncertainty. We do think that the radii were estimated accurate to within +- .1 unit.
A graph of # of packs vs. radius is shown below:
Because the volume of a pile can be thought of as being 'filled' with small cubes we conclude that when the dimensions of the pile double, the dimensions of the cubes double, which as we have seen gives us 8 times the volume, we expect that volume would be proportional to the cube of the diameter, and also that it would take 8 packs to double the diameter.
This leads us to expect that the appropriate proportionality is y = k x^3.
Using the DERIVE command fit( [x, ax^3], ##), where ## is the line in which the data have been authored, we obtain the function y = .072 x^3. This function is plotted with the data as shown below:
The data points appear to be randomly scattered a little above and a little below this line, with no clear pattern of above vs. below. This leads us to believe that we have a pretty good model.
An Excel power-function fit gives us the function y = .0111 x^2.67. The exponent is not exactly 3 but is closer to 3 than 2, so this tends to confirm our conjecture that the volume is proportional to the cube of the diameter.