Precalculus I Class 03/04
Quiz 0311
1. When dumping out piles of salt on the target we obtained the following data:
|
radius |
# packs |
|
2.25 |
1 |
|
2.9 |
2 |
|
3.6 |
3 |
|
3.9 |
4 |
|
4.2 |
5 |
|
4.4 |
6 |
|
4.5 |
7 |
Sketch a graph of log(# packs) vs. log(radius), using the log button on your calculator.
| log(rad) | log(#) |
| 0.352183 | 0 |
| 0.462398 | 0.30103 |
| 0.556303 | 0.477121 |
| 0.591065 | 0.60206 |
| 0.623249 | 0.69897 |
| 0.643453 | 0.778151 |
| 0.653213 | 0.845098 |
Sketch the straight line you think best fits your graph.
Find the slope and y-intercept of that line.
We estimate slope 2.7 and by extending the line we estimate a y-intercept around -1 to give us the equation y = 2.7 x - 1.
2. Quickly plot the following, using the x = -1, 1/2, 1 and 2 points and behavior near x = 0 as your guides:
| x | y=x^3 | y=x^4 | y=x^-1 |
| -1 | -1 | 1 | -1 |
| 0.5 | 0.125 | 0.0625 | 2 |
| 1 | 1 | 1 | 1 |
| 2 | 8 | 16 | 0.5 |
3. Using the graph of y = x^4, quickly sketch the graph of y = .1 (x+3)^4 - 1
We vertically stretch the graph of y = x^4 by factor .1. Basic point (1, 1), for example, goes to (1, .1).
Then we horizontally shift the graph -3 units (so when x = -3 we have (x+3)^4 = 0). Basic point (1, .1) for example goes to (-2, .1).
Then we horizontally shift the graph -1 unit (subtracting 1 from the result reduces our y coordinate by 1). Basic point (-2, .1) for example goes to (-2, -.9).
4. Using the graph of y = x^-1 quickly sketch the graph of y = 4 * x^-1 + 3
We vertically stretch the y = x^-1 graph by factor 4, then vertically shift 3 units.
5. Using the graphs of appropriate basic power functions sketch the graphs of the following:
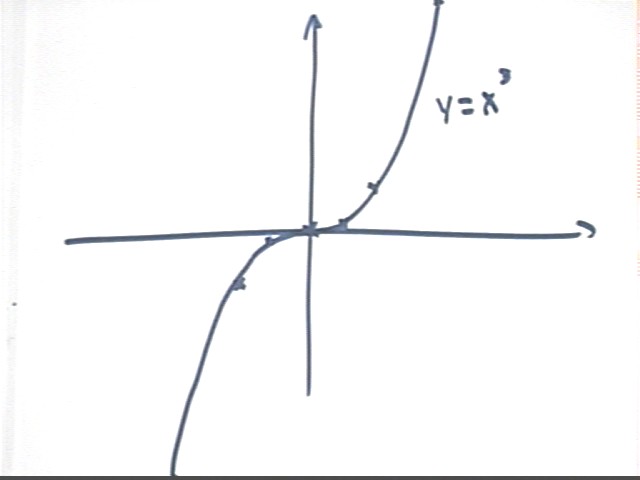
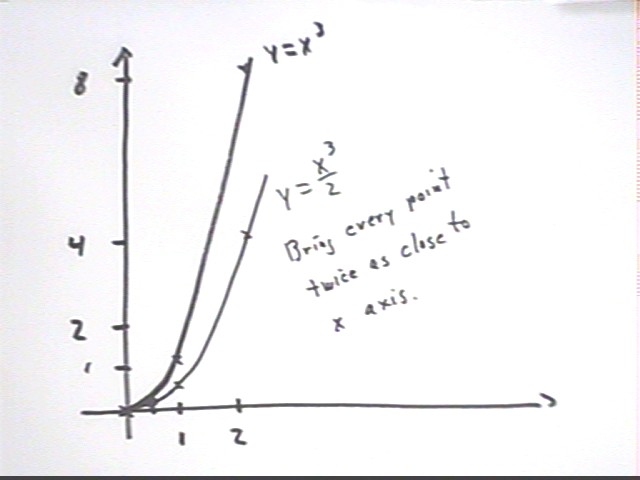
Quickly plot y = x^3
We mentally calculate y at x = 1/2, 1 and 2, obtaining values 1/8, 1 and 8. Plotting these basic points and recalling how the vertical and horizontal asymptotes are formed we get the first-quadrant part of the graph as shown below.
We then note that negative values of x will give the same results. except negative, as the corresponding positive values, making the graph symmetric with respect to the y axis. This allows us to sketch the second-quadrant part of the graph as a 'reflection' of the first-quadrant part.
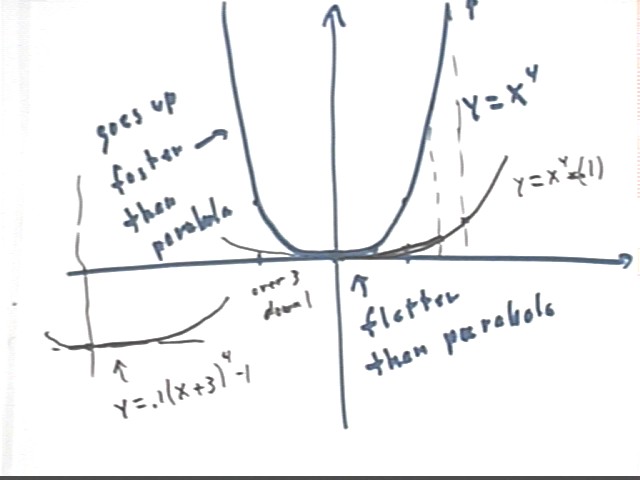
Quickly plot y = x^4
We mentally calculate y at x = 1/2, 1 and 2, obtaining values 1/16, 1 and 16. Plotting these basic points and recalling how the vertical and horizontal asymptotes are formed we get the first-quadrant part of the graph as shown below. We note that compared to a parabola the values of y = x^4 stay closer to the x axis when x < 0, especially when x is near 0, and that the graph goes up much more quickly when x > 1.
We then note that negative values of x will give the same results as the corresponding positive values, making the graph symmetric with respect to the y axis. This allows us to sketch the second-quadrant part of the graph as a 'reflection' of the first-quadrant part.
Note that steps in the construction of the graph of y = .1 (x+3)^4 - 1, a problem given below, are also indicated on this graph. The explanation will be given with that problem.
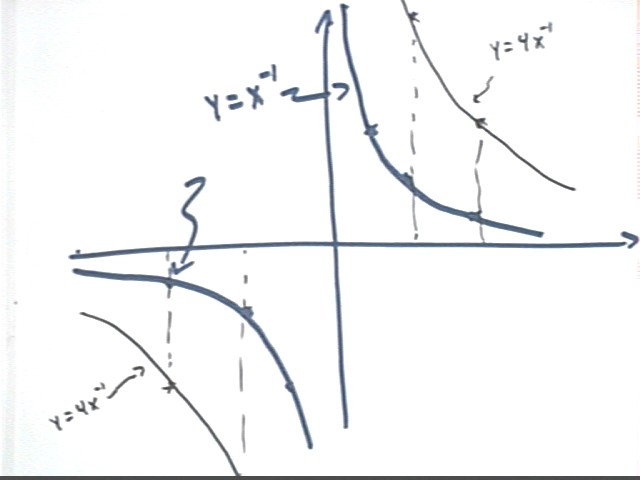
Quickly plot y = x^-1
We mentally calculate y at x = 1/2, 1 and 2, obtaining values 2, 1 and 1/2. Plotting these basic points and recalling how the vertical and horizontal asymptotes are formed we get the first-quadrant part of the graph as shown below.
We then note that negative values of x will give the same results as the corresponding positive values, making the graph symmetric with respect to the y axis. This allows us to sketch the second-quadrant part of the graph as a 'reflection' of the first-quadrant part.
Note that steps in the construction of the graph of y = 4 x^-1, part of a problem given below, are also indicated on this graph. The explanation will be given with that problem.
Using the graph of y = x^4, quickly sketch the graph of y = .1 (x+3)^4 - 1
Refer to the graph of y = x^4, sketched above.
We first vertically stretch that graph by factor .1, which moves each point 10 times closer to the x axis to give us the graph of 6 = .1 x^4.
We then shift the new graph -3 units in the horizontal direction and -1 units in the vertical direction. This moves its 'vertex' from (0, 0) to (-3, -1), where we sketch a 'new' set of axes to assist in sketching the translated graph.
These graphs are shown more accurately in the figure below:
Using the graph of y = x^-1 quickly sketch the graph of y = 4 * x^-1 + 3
Refer to the graph of y = x^-1, sketched above.
We first vertically stretch that graph by factor 4, which moves each point 4 times further from the x axis to give us the graph of y = 4 x^-1.
We will then shift the new graph 3 units in the vertical direction. This moves its 'vertex' from (0, 0) to (0, 3), where we will sketch a 'new' set of axes to assist in sketching the translated graph. This is not shown on the graph above.
The corresponding graphs are all shown accurately in the figure below:
Using the graphs you have already sketched sketch the graphs of the following:
The graph of y = x^3 / 2 is a vertical stretch by factor 1/2 of the graph of y = x^3. The graph should be constructed from the graph of y = x^3 by bringing every point twice as close to the x axis, not by plugging in values and making a table.
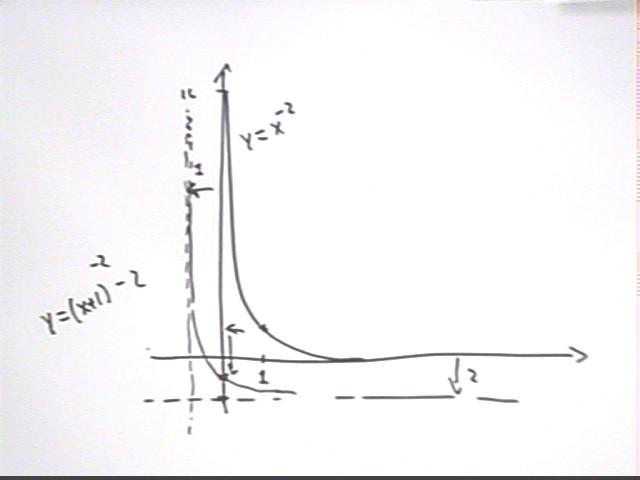
To construct the graph of y = (x+1)^-2 - 2 we note that this is the function we get if we start with y = x^-2 and replace x by x + 1, then add -2 to our result.
We construct our graph, giving it the same shape as that of the y = x^-2 graph but now passing through (0, -1) and asymptotic to the lines x = -1 and y = -2.
As another example of stretching and shifting we apply these ideas to the function y = 3^x, which we stretch by factor 2 then shift -4 units in the horizontal direction and -7 units in the vertical direction.
We began by observing two spherical containers full of water. After holding and comparing their 'feel' everyone was asked the following question:
Answers varied from 18 to 24, which as we will see turns out to be pretty good.
The other question was
Most people said about twice the diameter, and very few were able to make a decision between more than twice and less than twice the diameter.
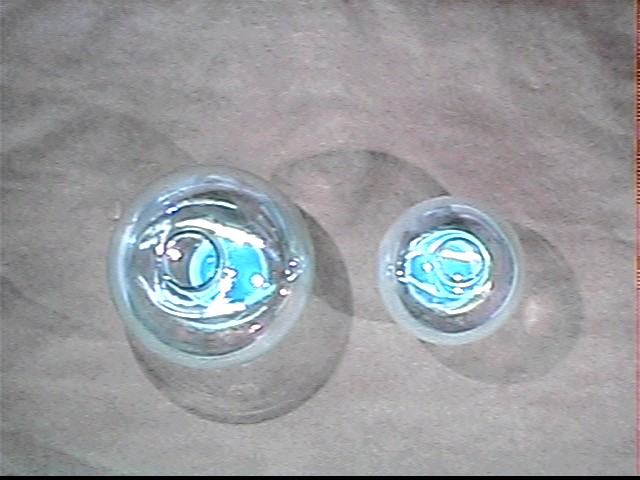
So the consensus was that the big sphere contains between 3 and 4 times as much water and is close to twice the diameter of the smaller.
Is this consistent?
No. As we've seen already if one solid has twice the linear dimension of another geometrically similar solid it has 2*2*2 = 2^3 = 8 times the volume. We're all very sure that if we were dying of thirst we wouldn't need 48 of the smaller sphere to make up for 6 of the larger.
What is our conclusion about how many times the diameter of the small we have in the large sphere?
If we have less than 8 times the volume, which seems very clear after handling and thinkin' about drinkin' the things, then we conclude that the big sphere is less than twice the diameter of the small.
Measurement shows that the smaller contains 100 ml of water while the larger contains 263 ml of water.
So how many times the diameter of the smaller is the larger?
If y is the volume and x the diameter we expect that the proportionality will be y = k x^3.
We know that the ratio of the volumes y is
So what is the ratio of diameters x2 / x1?
We know that y2 / y1 = 2.63 and y = k x^3 for some constant number k.
This means that y2 = k x2^3 and y1 = k x1^3, whatever diameters x1 and x2 go with volumes y1 and y2.
If this is the case then we can write y2 / y1 as
If we simplify the right-hand side we obtain the following:
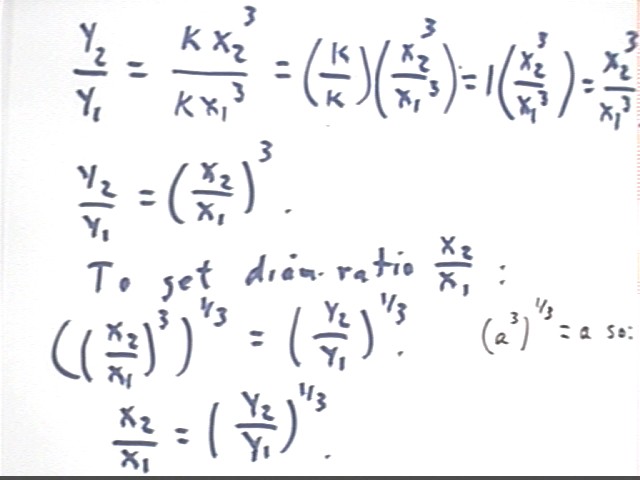
Thus we see that
To get x2 / x1 we take the 1/3 power of both sides, obtaining
What then should be the ratio of diameters for our spheres?
Recall that the ratio of volumes is y2 / y1 = 2.63. So the ratio of diameters will be
x2/x1 = (y2/y1)^(1/3) = 2.63 ^ (1/3) = 1.38.
How can we check this out?
We could measure diameters, but it's hard to line up the diameter with the meter stick. So we wrap a thin wire around the widest part of each sphere and find that the circumferences are 29 cm and 35 cm. This doesn't give us the 1.38 ratio we expect.
Directly measuring diameters with calipers we get 5.87 cm and 8.00 cm, for a ratio of x2/x1 = 8.00 / 5.87 = 1.36, pretty close to 1.38.
We don't expect this to be completely accurate because we're measuring the outer, not the inner diameter. Inner diameters will be a bit less than the diameters measured.
Challenge: Can you find the thickness of the glass from this information?