Quiz 0413
If Q(t) = Q0 * .7^t, then to two significant figures for what t is Q(t) equal to 1.3 Q0?
At what t does Q(t) = Q0 * .7 ^t reach .01 of its original value?
I've written down two numbers. When I multiply them together I get 0. Tell me the value of at least one of my numbers.
For what value(s) of x does the function y = f(x) = (x-3)(x+4)(x-7)^2 equal zero?
What do these results tell us about the graph of f(x) = (x-3)(x+4)(x-7)^2?
What other graph point can we most easily find?
log{base 2}(16) (start by making a table of y = 2^x then inverting columns to get log{base 2}
log{base 3}(81) (start with a table for y = 3^x)
log{base 5}(125)
log{base 4}(64)
log{base 4}(32).
log{base 8}(32).
log{base 25}(125)
log{base 9}(243)
log{base 16}(32)
log{base 27}(243)
Graph y = (x-2)^2 * (x^2+x+4) * (x+6).
log{base 2}(16) is the power of 2 we need to get 16.
Trial and error tells us that 2^4 = 16 so log{base 2}(16) = 4.
log{base 3}(81) is the power of 3 we need to get 81.
Trial and error tells us that 3^4 = 81 so log{base 3}(81) = 4.
log{base 5}(125) is the power of 5 we need to get 125.
Trial and error tells us that 5^3 = 125 so log{base 5}(125) = 3.
log{base 4}(64) is the power of 4 we need to get 64.
Trial and error tells us that 4^3 = 64 so log{base 4}(64) = 3.
log{base 4}(32). 4^2 = 16 and 4^3 = 64. So log{base 4}(32) is between 2 and 3.
Observe that 4^2 * 2 = 32, and that 2 = 4^(1/2). So
32 = 4^2 * 4^(1/2) = 4^(2.5) or 4(^5/2). So
log{base 4}(32) = 2.5 or 5/2.
log{base 8}(32). We need the power of 8 that is equal to 32.
We note that 8^(1/3) = 2, and 2^5 = 32. So
8^(1/3)^5 = 8^(5/3). Thus
log{base 8}(32) = 5/3.
Suggested problems:
log{base 25}(125)
log{base 9}(243)
log{base 16}(32)
log{base 27}(243)
log{base 2}(16) is 4. Verify using your calculator and the identity log{base b}(x) = log x / log b:
log{base 2}(16) = log(16) / log(2) = 4.
log{base 3}(81) is 4. Verify using your calculator and the identity log{base b}(x) = log x / log b:
log{base 3}(81) = log(81) / log(3) = 4.
log{base 5}(125) is 3. Verify using your calculator and the identity log{base b}(x) = log x / log b:
log{base 5}(125) = log(125) / log(5) = 3.
log{base 4}(64) is 3. Verify using your calculator and the identity log{base b}(x) = log x / log b:
log{base 4}(64) = log(64) / log(4) = 3.
log{base 4}(32) is 2.5.
log{base 4}(32) = log(32) / log(4) = 2.5.
log{base 8}(32).
log{base 8}(32) = log(32) / log(8) = 1.66666... .
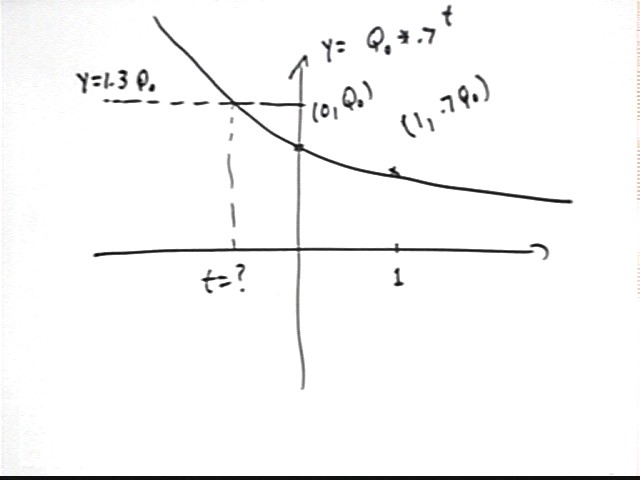
If Q(t) = Q0 * .7^t, then to two significant figures for what t is Q(t) equal to 1.3 Q0?
If Q(t) = 1.3 Q0 then Q0 * .7^t = 1.3 Q0.
So we need t such that Q0 * .7^t = 1.3 Q0.
We can simplify by multiplying both sides by 1/Q0 to get
.7^t = 1.3.
Pre-logarithms we can solve by trial and error.
A basic-points graph of Q(t) has basic points (0, Q0) and (1, .7 Q0). The x axis is a horizontal asymptote. Our basic points show us that we have a decreasing exponential, so the asymptote is along the positive x axis.
y = 1.3 Q0 occurs for a horizontal line above Q0; we can estimate where this occurs. We note that the corresponding t value is negative.
So we do trial and error with negative values of t.
The value is reasonably close to t = -1, which is a good starting point for a trial-and-error investigation.
We could also use logarithms.
We already have the equation .7^t = 1.3. We easily solve using logarithms:
.7^t = 1.3. Take log of both sides:
log(.7^t) = log(1.3)
t log(.7) = log(1.3)
t = log(1.3) / log(.7) = -.736, to 3 significant figures.
At what t does Q(t) = Q0 * .7 ^t reach .01 of its original value?
We first need to interpret the phrase '.01 of its original value'.
The original value is Q0 (if you plug in t = 0 you get Q(0) = Q0 * .7^0 = Q0, so the original value is Q0).
.01 of the original value means .01 times the original value.
So '.01 of the original value' is .01 Q0.
So we need to solve the equation Q(t) = .01 Q0. Since Q(t) = Q0 * .7^t, we have
Q0 * .7^t = .01 Q0.
Multiplying both sides by 1 / Q0 we get
.7^t = .01.
We can solve by trial and error or by logarithms.
We get
t = log(.01) / log(.7) = 12.9 approx.
I've written down two numbers. When I multiply them together I get 0. Tell me the value of at least one of my numbers.
One number gotta be 0. The only thing we can multiply a nonzero number by to get 0 is 0.
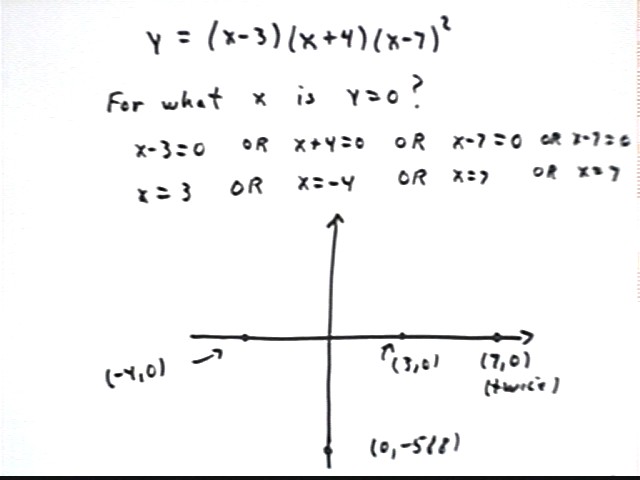
For what value(s) of x does the function y = f(x) = (x-3)(x+4)(x-7)^2 equal zero?
The expression is a product of 4 factors, (x-3), (x+4), (x-7) and (x-7). If the product is zero then at least one of the factors is zero.
x-3 = 0 if x = 3
x+4 = 0 if x = -4
x-7 = 0 if x = 7
x-7 = 0 if x = 7
So the zeros of this function occur at x = 3, -4, 7 and 7.
What do these results tell us about the graph of f(x) = (x-3)(x+4)(x-7)^2?
The graph passes through the points (-4,0), (3,0), (7,0) and (7,0).
What other graph point can we most easily find?
It's easy to plug in x = 0, which will give us the y intercept. We get y = (0-3)(0+4)(0-7)^2 = -3 * 4 * (-7)^2 = -588.
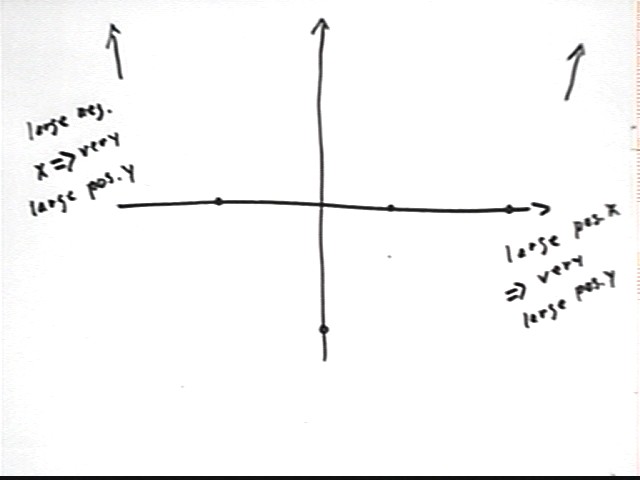
The figure below gives a sketch of what we know so far about the graph.
Using the five points (-4,0), (3,0) and (7,0), which are the only points at which the graph can pass thru or meet the x axis, and the point (0, -588), which is the only point at which the graph can pass thru the y axis, is it possible to construct a graph of the function?
We can make some guesses. However, given any of the points at which the graph meets the x axis, we don't know whether the graph passes through that point going upward, going downward or whether it might even just touch the axis, as does the vertex of a parabola.
The figures below show a variety of graphs which pass through these points. Note that the y scale of each graph is different, as you can tell by the location of the y-intercept, which in every case is (0, -588).
To get a better idea of how the graph behaves we can analyze the 'far-left' and 'far-right' behavior of this function. If x is 'far to the left' then x is a large negative number--meaning a negative number with a large magnitude. In this case the zeros lie between x = -4 and x = 7. A 'large' value of x for polynomial function is one that lies quite a bit further from the origin than any of the zeros. So a large negative x, for example, might be x = -100, or even x = -1000 or x = -1,000,000. If x is a large negative number, is y = (x-3)(x+4)(x-7)^2 positive or negative, and would you describe this number as small, large, very large, or really, really, really large?
If x is a large negative number then every factor is a large negative number (i.e., (x-3), (x+4), (x-7) and (x-7) are all large negative numbers), so y is a product of four large negative numbers. The product of four large negative numbers is positive, and the product of four large numbers is a very, very, very large number. So when x is a large negative number, y is a very, very, very large positive number.
If x is a large positive number, is y = (x-3)(x+4)(x-7)^2 positive or negative, and would you describe this number as small, large, very large, or really, really, really large?
If x is a large positive number then every factor is a large positive number (i.e., (x-3), (x+4), (x-7) and (x-7) are all large positive numbers), so y is a product of four large positive numbers. The product of four large positive numbers is positive, and the product of four large numbers is a very, very, very large number. So when x is a large positive number, y is a very, very, very large positive number.
What do we now know about the graph?
We know that as we approach the first zero (-4, 0) from the left we are coming from very, very, very large y values. So the graph must descend as we move from the left toward (-4, 0).
We know that as we leave the last zero, at (7, 0), we must begin approaching very, very, very large positive y values, so the graph must begin rising steeply.
See the figure below.
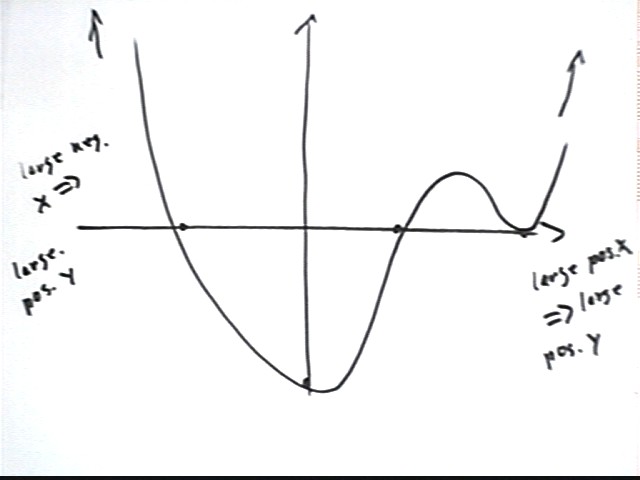
Can you sketch a graph with the given characteristics: very, very, very large positive values at far left and far right, passing through the axes only at the four indicated points?
If we start at far left and descend to the first zero at (-4, 0), then pass through the y axis at the y intercept, then upward through the x axis at (3, 0) then back down through the x axis at (7, 0) we won't be able to get back up through the x axis to approach the large positive values at far right, as depicted below.
We could try something like the graph depicted below, where we pass through or meet the x axis in a variety of strange ways and do manage to achieve our far left and far right behavior. The near-parabolic nature of the graph near x = 3 allows us to achieve the necessary zero at that point without actually going through the x axis, so we can end up approaching large positive values of y at both far left and far right. However there is no particular reason why this should happen at x = 3 as opposed to x = -4 or x = 7. And there is no apparent reason why we might want to 'flatten' the graph as it passes thru (-4, 0).
At which of the three zeros, x = -4, x = 3, or x = 7, would you expect the graph to act like a parabola? What therefore does your graph look like?
Since the zero at x = 7 occurs as a result of the squared factor (x-7)^2, and (x-7)^2 indicates a basic y = x^2 parabola shifted 7 units to the right, the most reasonable expectation is that the parabolic behavior will occur at x = 7.
This will result in a graph much like the one depicted below. An accurate graph generated by DERIVE is also depicted for comparison.
In what ways does the DERIVE graph differ from the sketched graph?
The low point of the sketched graph occurs to the right of the y axis, whereas the low point of the actual graph occurs well to the left of the y axis. The relative peak between y = 3 and y = 7 is closer to y = 3 than to y = 7, contrary to the sketched graph. And that peak is a bit lower on the DERIVE graph.
Graph y = (x-2)^2 * (x^2+x+4) * (x+6).
First we find the zeros.
Clearly we have zeros where (x-2) = 0, where (x^2+x+4) = 0 and where (x+6) = 0.
Two of these have obvious solutions, giving us zeros at x = 2 and x = -6.
Let's consider x^2 + x + 4 = 0. This will give us zero if, and only if, x = [ -1 +- sqrt(1^2 - 4 * 1 * 4) ] / ( 2 * 1). Whoa! Look at that discriminant. We get the square root of -15, which just cain't be. So there are no real zeros.
So the only zeros of (x-2)^2 * (x^2+x+4) * (x+6) are 2 and -6. Note that 2 is a second-degree zero.
We note that x^2 + x + 4 is positive for any positive x, and is never zero, so this factor can never become negative.
At far left (x-2) and (x+6) are negative so our y value is a product of 3 negative values (remember x-2 is there twice) and one positive (from the quadratic term). This gives us negative y values.
At far right all factors are positive so the result is positive.
Graph (x-2)^2 * (x^2+4x+1) * (x+6)
First we find the zeros.
Clearly we have zeros where (x-2) = 0, where (x^2+4x+1) = 0 and where (x+6) = 0.
Two of these have obvious solutions, giving us zeros at x = 2 and x = -6.
Let's consider x^2 + 4x + 1 = 0. This will give us zero if, and only if,
x = [ -4 +- sqrt(4^2 - 4 * 1 * 1) ] / ( 2 * 1).
This gives us zeros at
zeros: x = [-4 +sqrt(12)] / 2 and x = [-4 - sqrt(12) ] / 2 or
x = -.27 and x = -3.73, approx.
This means that x^2 + 4 x + 1 factors into (x + .27) ( x + 3.73), approx.
So our function is y = (x-2)^2 (x + .27) ( x + 3.73) (x+6).
What would the graph of y = (x-2)^2 * (x+5) * (x+6)^3 look like?
The graph will have zeros at x = 2, x = -5 and x = -6.
The zero at x = -6 will be of degree 3. It will level off for an instant as it passes thru the x axis, the same way the y = x^3 function levels off for an instant before passing thru the origin.
The zero at x = -5 is of degree 1, so will pass straight through the x axis.
The zero at x = 2 is of degree 2, so will act like a parabola near the point (2, 0).
At far left every factor is negative so the product of all six factors is a large positive number, and far right every factor is positive so the product of all six factors is a large positive number.
Note that the y intercept is 4320. The minimum value between x = -5 and x = -6 doesn't have a chance to get anywhere near this far from the x axis. So we have the choice between showing the detailed behavior near the zeros and showing the y intercept.
The graph shown below depicts this polynomial on a scale that allows us to see the leveling of the function at the x = -6 intercept and the dip below the x axis before coming back up thru the x = -5 intercept.
At an expanded y scale the exact locations of the x = -6 and x = -5 zeros is not clear, and we can barely discern the dip below the x axis. Note that the scale still does not show us the y intercept.
The same function graphed below on a scale that shows the y intercept does not show the relatively tiny dip below the x axis or the detailed behavior at x = -6 and x = -5. This graph appears to show a degree-4 zero somewhere between x = -6 and x = -5.
What would the graph of y = (x-2)^2 * (x-5) * (x+6)^3 look like?
This graph has zeros at x = -6 (a degree 3 zero), x = 2 (a degree 2 zero) and x = 5.
At the degree 3 zero the function levels off at the instant is passes through the x axis. Near the degree 2 zero we have parabolic behavior, and near the degree 1 zero the function is nearly linear.
For large positive x all six factors are positive, giving us a very large positive result.
For large negative x all six factors are negative, giving us a very large positive result.
The graph depicted below shows the behavior near the zeros without showing the max and min points.
The graph depicted below shows the behavior from the perspective of an expanded y scale.
y = (x-2)^2 * (x-5)^4 * (x+6)
The graph below shows the second-degree zero at x = 2, the fourth-degree zero at x = 6 and the first-degree zero at x = -6, but does not show the y-intercept and the relative peak value of the function between x = -6 and x = 2. It's also impossible to tell whether the function is increasing or decreasing for large negative x.
The graph below shows the behavior for large negative x and the relative peak and y-intercept values but the huge expansion required for the y scale obscures the behavior of the function at the other two zeros.