Precalculus I Class 01/09
The homepage for this course can be accessed through the address 164.106.222.236
The instructor's email addresses are given below. You are invited email the instructor at any time with specific, self-contained questions (e.g., don't ask 'how do you solve problem 7' but include a copy of problem 7 and a clear statement of what you do and do not understand about that problem along with your specific question). Use both addresses every time you email the instructor.
Allowing water to flow out of a hole in the bottom of a long tube we obtain the following table showing depth above the hole vs. total elapsed time since the very first 'time' was called out. The lowest mark is 10 cm above the hole, each mark is 10 cm above the one before it.
One group's results:
| Clock time y | Depth y |
| 0 | 90 |
| 14 | 80 |
| 27 | 70 |
| 42 | 60 |
| 59 | 50 |
| 78 | 40 |
| 99 | 30 |
| 127 | 20 |
| 167 | 10 |
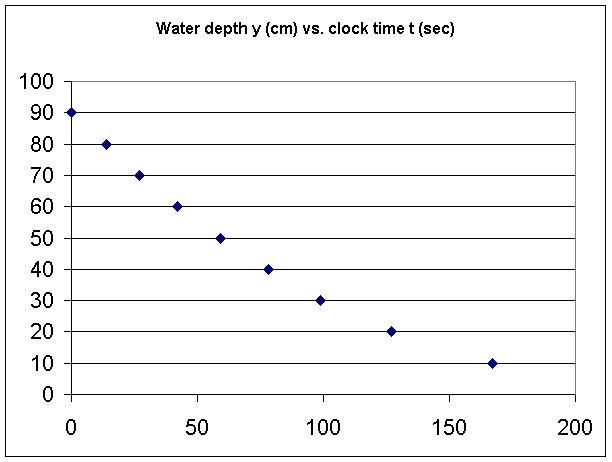
Graphing this data we obtain the following graph, which has the following important characteristics:
The water depth is decreasing with time, as we would expect from an leaky container.
The depth is decreasing more and more slowly, as indicated by the decreasing steepness of the graph. This is again what many would expect, that as the depth decreases the pressure and hence the rate of flow from the container will decrease.

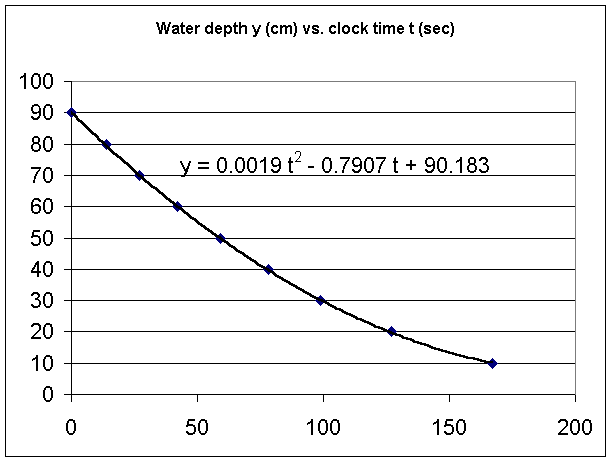
Creating a degree-2 polynomial trnedline we get an excellent quadratic model y = .0019 t^2 - .07907 t + 90.183. Note how this quadratic model passes very near the center of each data-point mark.
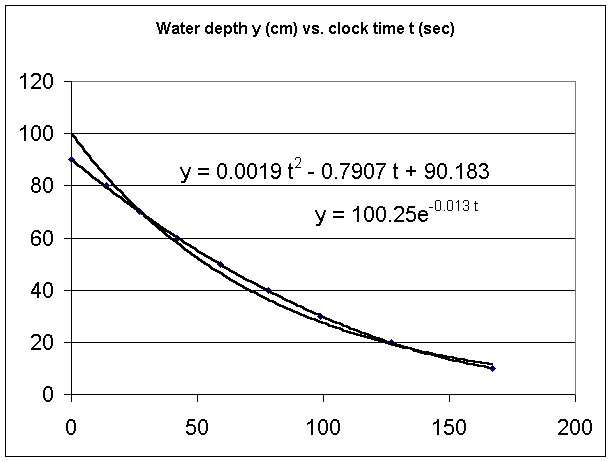
We also a not-so-good exponential model y = 100.25 e^(-.013 t). Note how the exponential graph significantly differs from the quadratic model, and also from the data points.
Our spreadsheet uses a sophisticated algorithm to arrive at these models. To understand the methods used would require a very good knowledge of calculus and of calculus-based statistics, which is well beyond the scope of this course. However there is a way to obtain and evaluate a quadratic model that is based only on fundamental algebra, specifically on the solution of a set of simultaneous equations.
The form of a quadratic function is y = a t^2 + b t + c. Any quadratic function can be expressed in this form.
We note that we need three quantities to get the specific function. The quantities are a, b and c. Once we know a, b and c we have a function that allows us to find y for any given value of t, and also to find (using the quadratic formula) any value or values of t that correspond to a given value of y.
To find the values of a, b and c for the given data we choose 3 data points and plug them into the model.
Using the points (14, 80), (59, 50) and (127, 20), each of the form (t, y), we plug the y coordinate of each into the form y = a t^2 + b t + c to get the three equations:
80 = a * 14^2 + b * 14 + c
50 = a * 59^2 + b * 59 + c
20 = a * 127^2 + b * 127 + c
Simplifying our equations we get
196 a + 14 b + c = 80
3481 a + 59 b + c = 50
16129 a + 127 b + c = 20
We need to solve these equations for a, b and c.
If we subtract the first equation from the second we get
3285 a + 45 b = -30
Subtracting the first equation from the third we get
15933 a + 113 b = -60
Now we have a system of 2 equations:
3285 a + 45 b = -30
15933 a + 113 b = -60.
We will continue solving this system at our next meeting.
Water depth vs. Clock Time
Additional Homework for Next Class
1. Below you see the Basic Function graphs of three of the four basic function types we cover in Mth 163. Number these 1, 2 and 3, in any order you choose. What are the coordinates of the points of each graph where x = -1, x = 0 and x = 1?
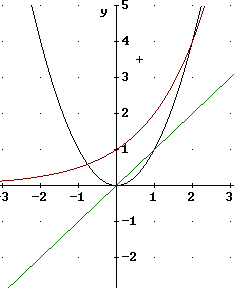
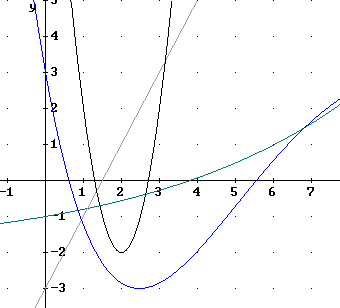
2. All but one of the four graphs shown in the figure below is of the same function type as one of the given functions. Number each and explain how the graph differs from the Basic Function graph. Possible differences include horizontal shift (i.e., shift to the right or left), vertical shift (i.e., shift up or down), and steeper or less steep.
3. For each of the three Basic Function graphs describe the characteristics that distinguish it from the other function types.
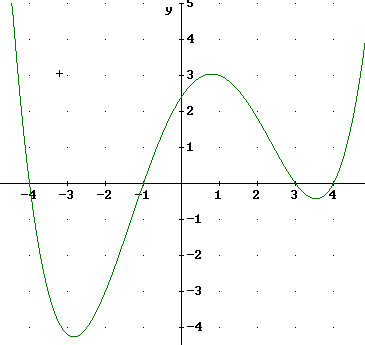
4. Specify the point, points, interval or intervals of the x axis over which each of the following is true of the graph below:
