Precalculus I Class 01/16
Additional Homework for Next Class
1. Below you see the Basic Function graphs of three of the four basic function types we cover in Mth 163. Number these 1, 2 and 3, in any order you choose. What are the coordinates of the points of each graph where x = -1, x = 0 and x = 1?
Let the linear graph be labeled 1, the quadratic graph 2, the exponential graph 3.
The 3 points are as follows:
2. All but one of the four graphs shown in the figure below is of the same function type as one of the given functions. Number each and explain how the graph differs from the Basic Function graph. Possible differences include horizontal shift (i.e., shift to the right or left), vertical shift (i.e., shift up or down), and steeper or less steep.
The parabolic graph appears steeper than that of the basic parabola, and is shifted 2 units in the horizontal direction and -2 units in the vertical direction.
The linear graph appears steeper than that of the basic linear function, and can be seen either as being shifted 1.5 units in the horizontal direction or -3 units in the vertical direction.
The graph passing through (0, -1) is a less-steep version of the exponential function, and can be seen as shifted -1 unit in the vertical direction.
The remaining graph, which passes through (0,3), is clearly not linear since it curves, not exponential since it doesn't approach a horizontal asymptote and not parabolic since it doesn't have an axis of symmetry.
3. For each of the three Basic Function graphs describe the characteristics that distinguish it from the other function types.
A linear graph forms a straight line.
A parabolic graph has an axis of symmetry through a vertex, and the steepness of a vertical parabola increases steadily as we move away from the vertex.
A exponential graph never changes direction and approaches a horizontal asymptote. There are other deeper characteristics that we will see later.
4. Specify the point, points, interval or intervals of the x axis over which each of the following is true of the graph below:
The vertical lines A, B and C indicate where the graph changes from increasing to decreasing. These lines are respectively at x = -2.8, x = .8 and x = 3.5, approximately.
The graph is decreasing to the left of A and between B and C.
The graph is increasing to the left of A and between B and C.
Thus the graph decreases on the intervals (-infinity, -2.8) and (.8, 3.5), and increases on the intervals (-2.8, .8) and (3.5, infinity).
The graph intercepts the x axis at the points on the x axis shown by dots. There points are (-4,0), (-1,0), (3,0) and (4,0). We note that the graph intercepts the x axis where y = 0. Since y is the value of the function, y= 0 means that the function values are zero these points are also the answer to the corresponding question.
The graph intercepts the y axis at the indicated point, whose coordinates are approximately (0, 2.3). Since this is the x = 0 point, this point is also the answer to the question concerning the points at which x is zero.
The value of the function is y. We sketch the line y = 2, as indicated below, and note the points where the graph of the function intersects this line. The points are approximately (-4.3,2), (.3,2), (1.9, 2) and (4.4, 2).
We add the lines D and E to separate the increasing and decreasing behaviors of graph and rate of increase or decrease.
To the left of A the graph is decreasing, but the decrease is getting more gradual so we say that the graph is decreasing at a decreasing rate.
From A to D the graph is increasing faster and faster so we say that it is increasing at an increasing rate.
From D to B the graph is still increasing, but more and more slowly so we say that it is increasing at a decreasing rate.
From B to E the graph is decreasing, and the decrease is more and more rapid, so we say that it is decreasing at an increasing rate.
From E to C the graph continues decreasing, but more and more slowly so we say that it is decreasing at a decreasing rate.
From C on the graph is increasing more and more rapidly, so we say that it is increasing at an increasing rate.
To answer the first two questions specifically we say that
The slope of the graph is increasing from the left side all the way up to line D. On this interval the graph starts with a negative slope; the negative slope becomes progressively more gradual so the negative number approaches zero, reaching zero at line A. A negative value that progressively approaches zero is increasing. Between A and D the slope is positive and increasing, so we see that the slope is increasing all the way from the left side of the graph to D.
The slope of the graph is decreasing from D to B, as the positive slope approaches zero, and also from B to E, at which point we have the steepest downward slope (hence the most extreme negative value).
Note that a decreasing slope makes the graph concave downward (i.e., from D to E), while and increasing slope makes the graph concave upward (i.e., from the left side to D and from E on through the right extreme of the graph).
The slope of the graph is positive where the graph is increasing, from A to B and beyond C.
The slope of the graph is positive where the graph is decreasing, from the left side to A and from B to C.
The value of the function is positive wherever y is positive, which is wherever the graph lies above the x axis. This occurs on intervals (-infinity, -4), (-1, 2) and (4, infinity).
The value of the function is negative wherever y is negative, which is wherever the graph lies below the x axis. This occurs on intervals (-4, -1), and (3,4).
Reviewing our work on the model from last class:
Our solutions are
a = 0.001995, b = -0.8123, c = 90.9816
giving us the model
y = 0.001995 t^2 + -0.8123 t + 90.9816, or
y = 0.001995 t^2 - 0.8123 t + 90.9816.
This compares with the model
y = 0.0019 t^2 - 0.7907 t + 90.183
given by our spreadsheet, which is based on all data points rather than just the 3 we have used here.
At t = 27 we obtain
y = 0.001995 * 27^2 -0.8123 * 27 + 90.9816 = 70.5,
representing a depth of 70.5 cm when t = 27 sec. This compares nicely with our observations, where we saw that t = 27 when y = 70.
Using the model find the clock time t at which the depth is 60, and compare with our observations.
Using y = 0.001995 t^2 -0.8123 t + 90.9816 we note that depth is represented by y so our equation becomes
60 = 0.001995 t^2 -0.8123 t + 90.9816.
This is a quadratic equation, which we solve using the quadratic formula. The quadratic formula tells us that the equation a t^2 + b t + c = 0 when and only when t = [- b +- sqrt( b^2 - 4 a c) ] / (2 a).
We subtract 60 from both sides to get the equation into the form of a quadratic:
0.001995 t^2 -0.8123 t + 30.9816 = 0.
We obtain
t = [ - (-.8123) +- sqrt( (-.8123)^2 - 4 * .001995 * 30.9816) ] / (2 * .001995) ]
Simplifying we obtain solutions 42.59 and 364.6, indicating that the depth is 60 when t = 42.59 or when t = 364.6.
The 364.6 corresponds the upward part of the parabolic graph, which has nothing to do with the real-life situation and is rejected.
t = 42.59 is very close to our real-world observation that y = 60 when t = 42.
Illumination vs. distance data:
Use 3 data points of form (distance, illumination), which is illumination vs. distance:
(3, 105)
(6, 25)
(8, 16).
Using the quadratic form y = a x^2 + b x + c, where y is illumination and d is distance, we get the equations
105 = a * 3^2 + b * 3 + c
25 = a * 6^2 + b * 6 + c
16 = a * 8^2 + b * 8 + c
We solve this system.
We solve by setting the system up as a matrix and reducing it. Derive does this by executing the command row_reduce([[3^2,3,1,105],[6^2,6,1,25],[8^2,8,1,16]]), which when simplified gives us the matrix [1, 0, 0, 4.433333333; 0, 1, 0, -66.56666666; 0, 0, 1, 264.8].
Our solution, rounding to 3 significant figures, is
a = 4.43
b = -66.6
c = 265
and our function is
y = 4.43 x^2 - 66.6 x + 265.
We note that this model doesn't fit all the data well. It works very well from x = 3 through x = 10, but poorly for x = 1 and x = 2.
To see the range of distances for which illumination is between 25 and 100 we do the following:
Let y = 25 and solve for x.
Let y = 100 and solve for x.
The equations are
25 = 4.43 x^2 - 66.6 x + 265 and
100 = 4.43 x^2 - 66.6 x + 265.
Be sure to subtract the left-hand side from both sides in each equation to get into the form a x^2 + b x + c = 0.
The solutions will be
x = 5.99 for illumination 25 and
x = 3.13 for illumination 100.
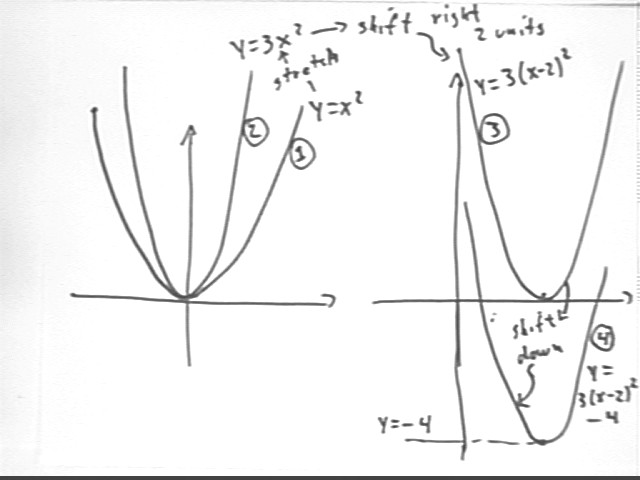
The figure below shows how the y = x^2 graph can be 'stretched' in the vertical direction by a factor of 3 to obtain the graph of y = 3 x^2, then shifted horizontally 2 units to the right to obtain the graph of y = 3 ( x - 2)^2, then finally shifted down 4 units to obtain the graph of y = 3 ( x - 2)^2 - 4.
The rules we use are the following, which you should have encountered in prerequisite courses. They are included here to refresh your memory but if you don't recognize them don't be overly concerned; they will be developed in your assignments.
when the graph of a function (graph number 1) is vertically stretched by a factor A then the resulting graph (graph number 2) represents the original function multiplied by A
when the graph of a function is horizontally shifted h units to obtain graph number 3 then x is replaced by x - h
when the graph of a function is vertically shifted k units to obtain graph number 4 then k is added to the function (in the present example k would be negative).
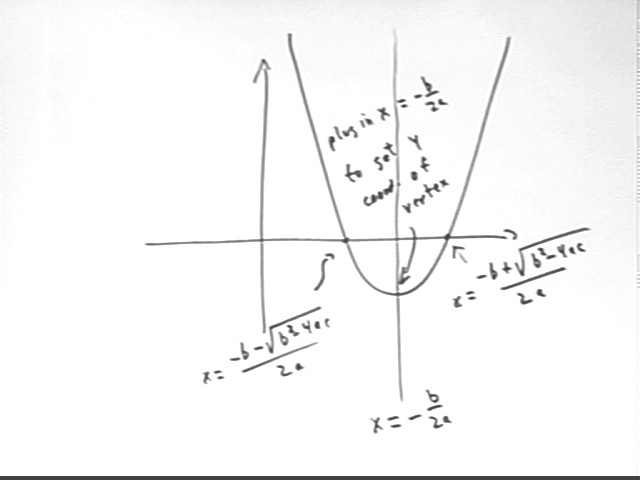
A quadratic function y = a x^2 + b x + c which crosses the x axis does so where x = (-b + sqrt( b^2 - 4 a c) ) / (2a) and where x = (-b - sqrt( b^2 - 4 a c) ) / (2a). The axis of symmetry for the function is halfway between these two zeros, at x = - b / (2 a).
The vertex of the parabola lies on the axis of symmetry. So obtain the y coordinate of the vertex we can substitute x = - b / (2 a) into the equation y = a x^2 + b x + c.
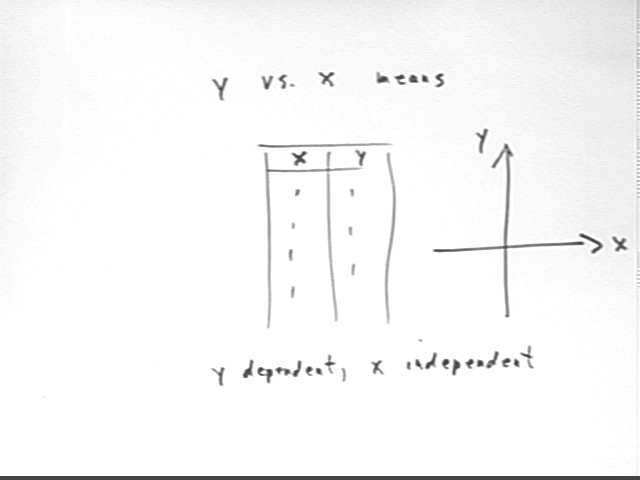
Note the meaning of 'y vs. x':
The figure below depicts, among others, the graphs of y = x^2, y = 3 x^2 and y = x^2 / 3. Number these graphs 1, 2 and 3 in the specified order.
One of the graphs was obtained by horizontally and vertically shifting the graph of y = x^2, another by shifting the graph of y = 3 x^2 and another by shifting the graph of y = 1/3 x^2. Number these graphs 4, 5 and 6, in order.
Let graph 1 be the graph that passes through (0, -2). Number that graph #1 and call the function represented by the graph Function 1.
Let graph 2 be the graph that passes through (0, -4). Number that graph #2 and call the function represented by the graph Function 2.
Let graph 2 be the graph that passes through (0, 0). Number that graph #3 and call the function represented by the graph Function 3.
Let graph 2 be the graph that passes through (0, -1). Number that graph #4 and call the function represented by the graph Function 4.
Which function has a graph that has the same identical shape as Graph 1? This means that if you traced Graph 1 on a piece of thin paper, then moved the paper to cover the other graph your trace would exactly match that curve.
Which graph lies at a constant vertical distance from Graph 1? How can you tell?
Which graph could you get if drew Graph 1 on an elastic sheet and 'stretched' the sheet by a consistent factor in the vertical direction?
Sketch the graph you would get if you stretched the graph depicted below vertically by a factor of 3.
Sketch the graph you would get if you stretched the graph depicted below vertically by a factor of 1/2.
Sketch the graph you would get if you stretched the graph depicted below vertically by a factor of -2.
Sketch the graph you would get if you shifted the graph depicted below 3 units in the vertical direction.
Sketch the graph you would get if you shifted the graph depicted below 2 units in the horizontal direction.
Sketch the graph you would get if you stretched the graph depicted below vertically by a factor of 3 then shifted it -1 unit in the vertical direction and -1/2 unit in the horizontal direction.