Precalculus I Class 01/21
Quiz 0121
1. If you picked the three points (10,77), (40, 31) and (80, 12) what three equations would you solve to obtain the quadratic model? Don't actually solve these equations.
2. The quadratic model for these equations is y = 0.0151t^2 - 2.29 t + 98.4.
How would you determine the value of y for t = 20?
How would you determine the value of t for which y = 40?
Tell specifically how you would find the coordinates of the vertex of the graph of this function.
3. Quickly locate the work you did on Problem 2 under Completing the Flow Model. Give the following:
The three equations you solved to get your model.
The specific quadratic function model you obtained.
The percent of classes reviewed to get a 3.0.
Based on the t = 10, t = 50 and t = 90 points of the grade vs. percent of review model we get
y = = - 0.000119·t^2 + 0.0316·t + 1.49
which we express is function notation as the function grade1:
grade1(t) := - 0.000119·t^2 + 0.0316·t + 1.49
The name grade1 indicates that this is the first of the grade models based on this data.
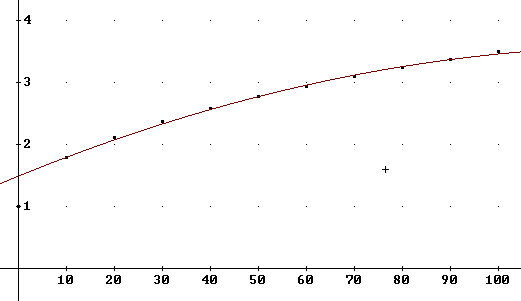
The figure below shows the data points and the curve corresponding to the grade1(t) model. Note that the curve does pass precisely through the t = 10, t = 50 and t = 90 graph points. Note also that the curve does very well for all graph points from t = 10 through t = 100. However it doesn't do a good job with the t = 0 point (0, 1), on the y axis.

What is the maximum possible grade average based on this function?
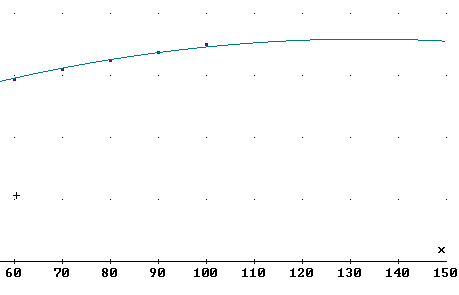
The parabola formed by the graph of the grade1(t) function can be extended past the t = 100 point, as shown below:

The maximum grade average will occur at the vertex, which we see from the graph occurs somewhere between t = 130 and t = 140, and the grade corresponding to the vertex is a bit closer to y = 4 than to y = 3.
To get the precise coordinates of the vertex we first note that the vertex of y = a t^2 + b t + c is at t = -b / (2 a) .
The vertex occurs at t = -b / (2a) = -.0316 / (2 * (-.000119) ) = 133, approx..
The max grade will be value of the grade function at the vertex.
Evaluating grade1(t) at t = 133 we get
grade1(133) = - 0.000119·133^2 + 0.0316·133 + 1.49 = 3.59
What grade would we expect from a halfway effort of 50% review?
We evaluate grade1(50), plugging in 50 for t, to obtain
grade1(50) = - 0.000119·50^2 + 0.0316·50 + 1.49 = 2.77.
If our goal is 3.00 then how much review do we need to do?
We need grade1(t) = 3.00. So we solve the equation
- 0.000119·t^2 + 0.0316·t + 1.49 = 3.00
We first get the equation into the form a t^2 + b t + c = 0 so we can use the quadratic formula. To do so we subtract 3.00 from both sides to get
- 0.000119·t^2 + 0.0316·t - 1.51 = 0
Then we plug into the quadratic formula and get two solutions:
t = 62.5 OR t = 203
literally meaning that we could use 62.5% review or 203% review to get the 3.00 average.
The 203% result is probably unrealistic. In the first place we would go with the 62.5%, for obvious reasons. In the second place we don't expect that after peaking around 130% the performance would then start to decline; although a fatigue factor might conceivably cause this to happen the nature of the curve would probably be different.
Our previous model grade1(t) was based on just three points, and as we recall did a very good job for all the points except the t = 0 point. We might want to accept that model, with the idea that the no-review performance corresponding to t = 0 is a special case, that even a little review is much better than no review, and that we already know what happens when people don't make any effort.
On the other hand we might want a model that takes into account all the data points, so we might want a model based on all the data.
A quadratic best-fit based on all the points is
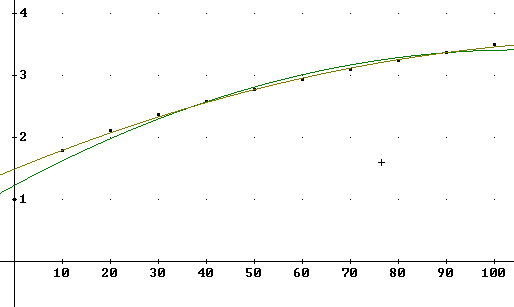
grade(t) = - 0.000199·t^2 + 0.0417·t + 1.23
The graph below shows the grade(t) function as well as the previous grade1(t) function. We see that the new function does a better job at t = 0, but doesn't do nearly as well over the remainder of the data points.

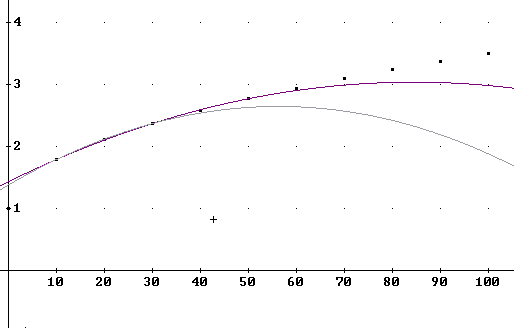
The graph below shows two more functions:
grade2(t) := - 0.000225·t^2 + 0.038·t + 1.433 based on t = 10, 30, 50 points
grade3(t):=-.0004 t^2 + .045 t + 1.38 based on t = 10, 20, 30 points.
You should be able to tell which function is which by the data points through which each passes precisely.
Neither function gives a good model above 70%, and both models decrease before we reach 100%, which is unrealistic.
The problem with both of these models is that they are based not on a wide range of t values but on a narrow range between t = 10 and t = 50 in the case of the grade2(t) function, and an even narrower range in the case of the grade3(t) function.
