Precalculus I Class 01/28
Note answers to previous graphing problems after regular class notes
Quiz 0128
If f(t) = 1.04^t then what is the expression for each of the following:
f ( 4 )
f(4) = 1.04^4 = etc.
This is represented in standard notation in the figure at the end of these Quiz Problems.
f (6) / f( 3)
f(6) / f(3) = 1.04 ^ 6 / ( 1.04 ^ 3) .
We can simplify this expresion using the law of exponents that says that a^x / (a^y) = a^(x-y).
1.04 ^ 6 / ( 1.04 ^ 3) = 1.04 ^ * (6 - 3) = 1.04 ^ 3.
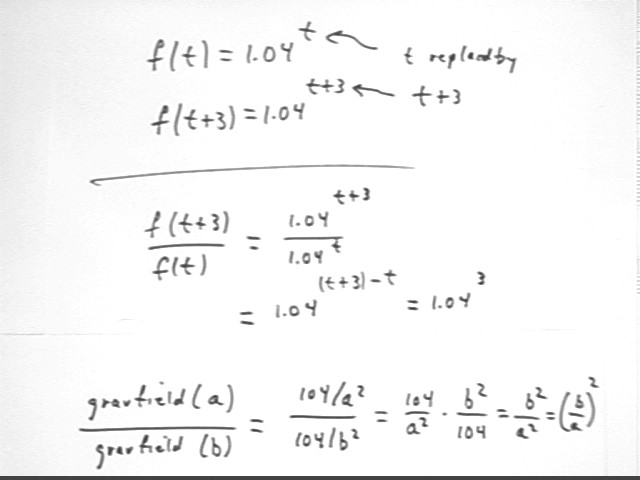
f(t + 3)
f(t+3) = 1.04 ^ (t + 3)
COMMON ERROR: f(t+3) = 1.04^t + 3, where the 3 is no longer part of the exponent. The exponent must be t + 3, so it must be grouped as (t+3).
f(t+3) / f(t)
f(t+3) / f(t) = 1.04^(t+3) / ( 1.04^t).
This simplifies using the same law of exponents as before, giving us
1.04^[ (t + 3) - t ] = 1.04^3.
See the figure for the standard-notation representation of this simplification.
If gravField(r) = 104 / r^2 then
What is gravField(10)?
gravField(10) = 104 / 10^2 = 104 / 100 = 1.04.
For what value of r is gravField(r) equal to .8?
gravField(r) = 104 / r^2 so gravField(r) = .8 if
104 / r^2 = .8
We can solve this equation for r. First we multiply the equation by the common denominator r^2:
(104 / r^2) * r^2 = .8 * r^2, which gives us
104 = .8 r^2.
Now we multiply both sides by 1 / .8 to get
104 / .8 = r^2 or
130 = r^2
The solution to this equation is
r = +- sqrt(130) , which we can approximate to any appropriate number of significant figures.
If r is a distance then since distance can't be negative we just use r = sqrt(130).
What is gravField( a ) / gravField( b )?
gravField(a) = 104 / a^2
gravField(b) = 104 / b^2
So
gravField(a) / gravField(b) = 104/a^2 / [ 104/b^2 ]
We can simplify this:
104/a^2 / [ 104/b^2 ] = 104 / a^2 * [ b^2/104 ] = b^2 / a^2 = (b/a)^2.
See the figure below.
Be sure to review Laws of Exponents, Complex Fraction and other algebra topics that might have been confusing to you in these exercises. You don't want to stumble over these details while you're trying to learn precalculus.
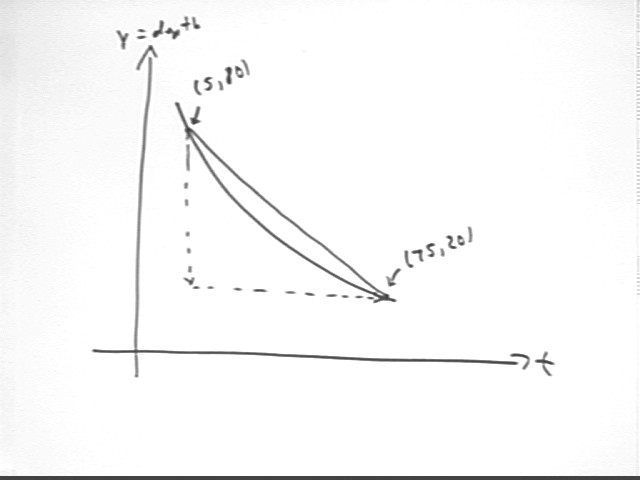
The figure below depicts a depth vs. clock time graph. Between the points (5, 80) and (75, 20):
Depth change is final depth - initial depth = 20 cm - 80 cm = - 60 cm.
Change in clock time = final clock time - initial clock time = 75 sec - 5 sec = 70 sec.
Ave rate of change of position = change in position / change in clock time = -60 cm / (70 sec) = -.857 cm /s.
Slope = rise / run = -60 cm / (70 sec) = -.857 cm / s.
We note that the slope between the two points is equal to the average rate of depth change between the corresponding clock times.
Solution to Worksheet Assignment submitted 1/21/03:
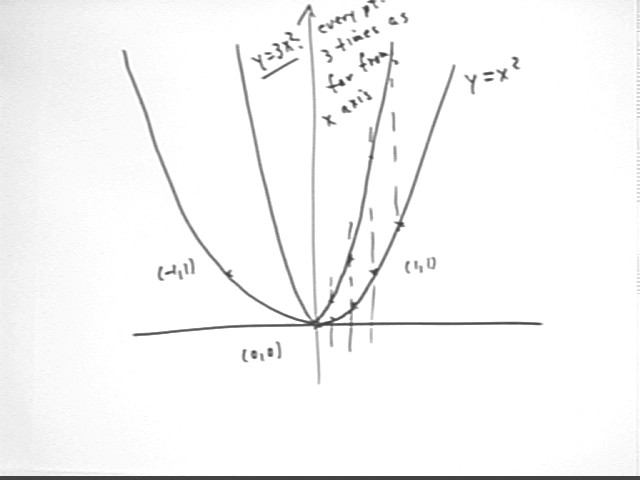
The figure below depicts, among others, the graphs of y = x^2, y = 3 x^2 and y = x^2 / 3. Number these graphs 1, 2 and 3 in the specified order.
One of the graphs was obtained by horizontally and vertically shifting the graph of y = x^2, another by shifting the graph of y = 3 x^2 and another by shifting the graph of y = 1/3 x^2. Number these graphs 4, 5 and 6, in order.
The y = x^2 graph passes through (0,0), (-1,1) and (1,1). The only graph that does so is labeled #1 in the figure below.
See also the first figure following these solutions.
The y = 3 x^2 graph is vertically stretched by factor 3, leaving the (0,0) point alone and shifting the points (-1,1) and (1,1) to (-1, 3) and (1, 3). This graph is labeled #2 in the figure below.
See also the first figure following these solutions.
The y = 1/3 x^2 graph is vertically stretched by factor 1/3, leaving the (0,0) point alone and shifting the points (-1,1) and (1,1) to (-1, 1/3) and (1, 1/3). This graph is labeled #3 in the figure below.
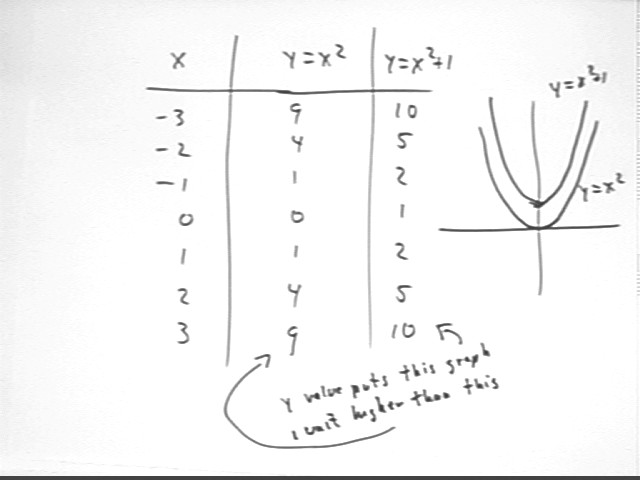
The shifted graph of y = x^2 will have the same shape, hence the same steepness, as graph #1. The only graph with this characteristic is the graph labeled #4 below. Note that the vertex of this graph is at (0, 1), indicating that it has been vertically shifted 1 unit relative to the y = x^2 graph.
See also the second figure following these solutions.
The shifted graph of y = 3 x^2 will have the same shape, hence the same steepness, as graph #2. The only graph with this characteristic is the graph labeled #5 below. Note that the vertex of this graph is at (2, -3), indicating that it has been vertically shifted -3 units and horizontally shifted 2 units relative to the y = 3 x^2 graph.
The shifted graph of y = 1/3 x^2 will have the same shape, hence the same steepness, as graph #3. The only graph with this characteristic is the graph labeled #6 below. Note that the vertex of this graph is at (-2, -1), indicating that it has been vertically shifted -1 unit and horizontally shifted -2 units relative to the y = 1/3 x^2 graph.
Let graph 1 be the graph that passes through (0, -2). Number that graph #1 and call the function represented by the graph Function 1.
Let graph 2 be the graph that passes through (0, -4). Number that graph #2 and call the function represented by the graph Function 2.
Let graph 2 be the graph that passes through (0, 0). Number that graph #3 and call the function represented by the graph Function 3.
Let graph 2 be the graph that passes through (0, -1). Number that graph #4 and call the function represented by the graph Function 4.
The figure below indicates the four graphs. Trace each graph to be sure it passes through the indicated point.
(0, -4) is 4 units below the x axis; (0, -2) is 2 units below the x axis, half as far as (0, -4). So the statement is true.
The vertical line is depicted in the figure below. On this line the y coordinate on graph 2 is about 3.6 and the y coordinate on graph 1 is about 1.3. So the graph 2 point does appear to be about twice as far from the x axis as the graph 1 point.
The vertical line is depicted in the figure below. On this line the y coordinate on graph 2 is now shown but appears to be lower than -5, somewhere between -5 and -6 while the y coordinate on graph 1 is about -2.7. If the graph 2 point lies at -5.4, which appears about right, then this point does appear to be about twice as far from the x axis as the graph 1 point.
A vertical line through any x value shows that Function 2 appears to be about twice as far from the x axis as Function 1. Checking that this is so for several x values convinces us that Function 2 lies at every point about twice as far from the x axis as Function 1.
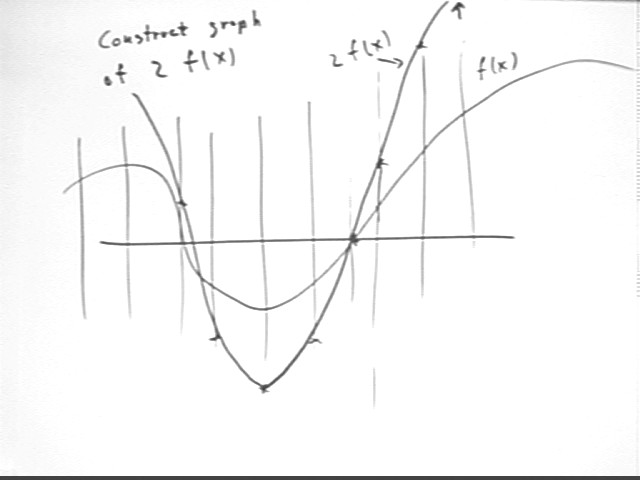
See also the third figure below for the construction of a graph of 2 * f(x) that is stretched by a factor of 2 from the graph of an original function f(x). This graph is constructed by sketching several vertical lines and on each line doubling the distance of each point of the f(x) graph to get a point of the 2 f(x) graph; the graph of the 2 f(x) function is then sketched through these points.
Which function has a graph that has the same identical shape as Graph 1? This means that if you traced Graph 1 on a piece of thin paper, then moved the paper to cover the other graph your trace would exactly match that curve.
At every x value Graph 2 is clearly steeper than Graph 1, while Graph 4 is less steep. So neither of these graphs has the same shape as Graph 1.
Graph 3, on the other hand, appears for any x value to have the same steepness as Graph 1. Furthermore Graph 3 appears for any x value to lie about 2 units higher than Graph 1. So we conclude that Graph 3 would be the one to match Graph 1.
Which graph lies at a constant vertical distance from Graph 1? How can you tell?
Graph 3 appears to always lie 2 units higher than Graph 1. From any Graph 1 point we can go straight up 2 units and arrive at a Graph 2 point.
Which graph could you get if drew Graph 1 on an elastic sheet and 'stretched' the sheet by a consistent factor in the vertical direction?
As we have seen Graph 2 always lies twice as far from the x axis as Graph 1. Thus we could obtain Graph 2 by vertically stretching Graph 1 by a factor of 2.
Graph 4 can be seen at every point to lie twice as close to the x axis as Graph 1. Thus Graph 2 could be obtained from Graph 1 by vertically stretching Graph 1 by a factor of 1/2 (which would really be a compression, moving every point of Graph 1 half as far from the x axis).
Sketch the graph you would get if you stretched the graph depicted below vertically by a factor of 3.
The original graph is numbered 0 in the figure below, and passes through the x axis at x = -3, -1 and 2, through the y axis at y = -1. You will probably need to trace this graph to distinguish it from the others.
If this graph is stretched vertically by factor 3 every point will move 3 times as far from the x axis, so the stretched graph will still pass through the x axis at x = -3, -1 and 2, and through the y axis at y = -3. The graph with these characteristics is marked #1 in the figure. You will likely need to trace this graph to distinguish it from the others, as will be the case for the other graphs in the figure. Note at several x values that this graph is always 3 times as far from the x axis as the original.
Sketch the graph you would get if you stretched the graph depicted below vertically by a factor of 1/2.
If this graph is stretched vertically by factor 1/2 every point will move 1/2 as far from the x axis, so the stretched graph will still pass through the x axis at x = -3, -1 and 2, and through the y axis at y = -1/2. The graph with these characteristics is marked #2 in the figure. You will likely need to trace this graph to distinguish it from the others, as will be the case for the other graphs in the figure. Note at several x values that this graph is always 1/2 times as far from the x axis as the original.
Sketch the graph you would get if you stretched the graph depicted below vertically by a factor of -2.
If this graph is stretched vertically by factor -2 every point will move twice as far from the x axis and will also appear on the other side of the x axis, so the stretched graph will still pass through the x axis at x = -3, -1 and 2, and through the y axis at y = 2. The graph with these characteristics is marked #3 in the figure. Note at several x values that this graph is always twice as far from the x axis as the original and on the opposite side of the x axis.
Sketch the graph you would get if you shifted the graph depicted below 3 units in the vertical direction.
If this graph is shifted vertically 3 units every point will move 3 units lower, so the shifted graph will no longer pass through the x axis at x = -3, -1 and 2. It will pass through the y axis at y = -4. The graph with these characteristics is marked #4 in the figure. Note at several x values that this graph is always 3 units lower than the original.
Sketch the graph you would get if you shifted the graph depicted below 2 units in the horizontal direction.
If this graph is shifted horizontally 2 units every point will move 2 units to the right, so the shifted graph will now pass through the x axis at x = -1, 1 and 4. The graph with these characteristics is marked #5 in the figure. Note at several points on Graph 1 that Graph 5 is always 2 units to the right of the original.
Sketch the graph you would get if you stretched the graph depicted below vertically by a factor of 3 then shifted it -1 unit in the vertical direction and -1/2 unit in the horizontal direction.
As is the case with the first graph a vertical stretch by factor 3 will make the graph 3 times as steep at every point as graph #1. Shifting the graph will not change its shape so the graph will be congruent to graph #1 but will lie 1 unit lower and 1/2 unit to the left. This graph is labeled #6.
The figure below depicts a number of vertically stretched quadratic functions.