Precalculus I Class 02/04
If f(x) = x2, give the vertex and the three basic points of the graphs of f(x--.75), f(x) - -.15, .5 f(x) and .5 f(x--.75) + -.15. Quickly sketch each graph.
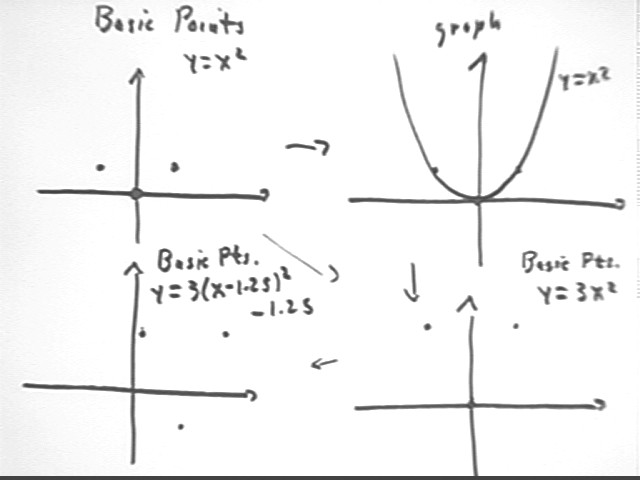
Sketch a graph of y = x^2, from x = -3 to x = 3. Then sketch a graph of y = 3 x^2 over the same domain.
Use 3 basic points (0,0), (-1,1) and (1,1).
3 basic points stretched by factor 3 from x axis become (0,0), (-1,3) and (1,3).
Sketch the second graph shifted 1.25 units in the x direction and -1.25 units in the y direction.
What are the three basic points of this graph?
The basic points of the preceding graph are shifted 1.25 units in x direction and -1.25 units in the y direction to (1.25,-1.25), (-.25, 1.75) and (2.25, 1.75).
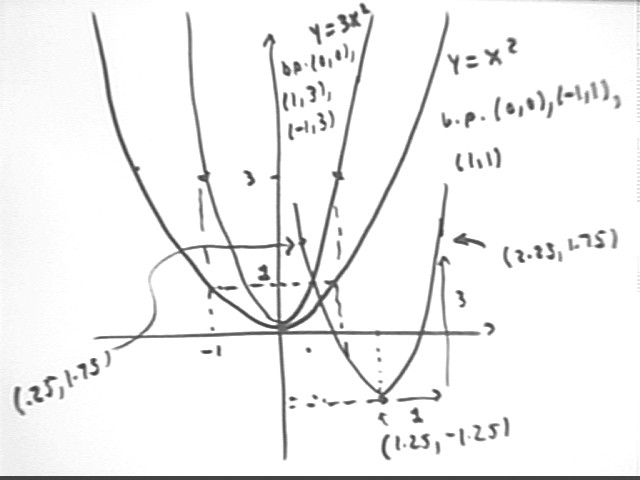
The graph below indicates how we start with the three basic points for y = x^2, then construct an approximate graph of y = x^2 by sketching the parabola defined by these points.
We can also move from the basic points of y = x^2 to those of y = 3 x^2 by tripling the distance of every point from the x axis. Then having done this we can shift these points 1.25 units in the x direction and -1.25 units in the y direction to obtain the basic points for the function y = 3(x-1.25)^2 - 1.25.
The resulting graphs are depicted below.
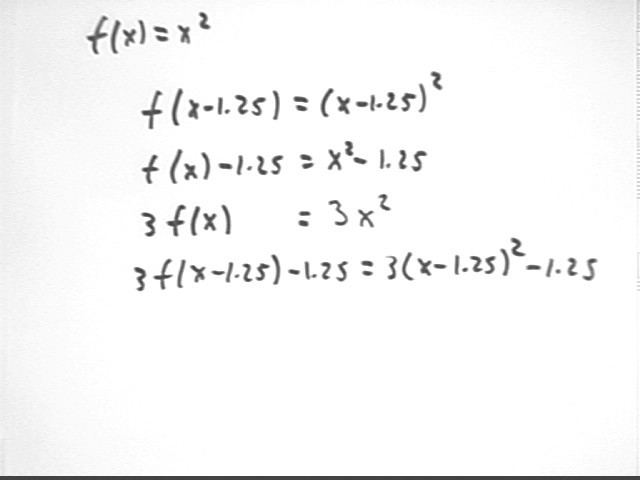
If f(x) = x^2, then what are
Substituting x-1.25 for x in the definition f(x) = x^2 we obtain f(x-1.25) = (x-1.25)^2.
Adding the expression -1.25 to f(x) = x^2 we obtain f(x) - 1.25 = x^2 - 1.25.
Multiplying f(x) = x^2 by 3 we obtain 3 f(x) = 3 x^2.
Starting with f(x) = x^2, substituting x - 1.25 for x, multiplying the result by 3 then adding -1.25 we obtain 3 f(x-1.25) - 1.25 = 3(x-1.25)^2 - 1.25.
For the quadratic function y = f(t) = .02 t2 + -2.69 t + 99, determine the average rate of change of y with respect to t, between clock times t = 39 and t = 45.
change in y is f(45) - f(39) = 18.5 - 24.5 = -6
change in t is t2 - t1 = 45 - 39 = 6.
So ave rate of change of y wrt t is
If water depths of 10, -6.2, -16.9 and -22.2 cm are observed at clock times 21.4, 32.1, 42.8 and 53.5 sec, then at what average rate does the depth change during each time interval?
The table below summarizes our information in columns 1 and 2. In column 3 we calculate `dt and in column 4 we find `dy, then use these results to find the ave rate of change `dy/`dt..
| t | y | `dt | `dy | `dy/`dt |
| 21.4 | 10 | |||
| 32.1 | -6.2 | 10.7 | -16.2 | -1.514019 |
| 42.8 | -16.9 | 10.7 | -10.7 | -1 |
| 53.5 | -22.2 | 10.7 | -5.3 | -0.495327 |
Rates of change are -1.514, -1, -.495. They go up by about .5 with each interval. Small discrepancies in the changes are due to rounding errors.
All quadratic functions: ave rates of change calculated on succeeding intervals of uniform width always change by the same amount.
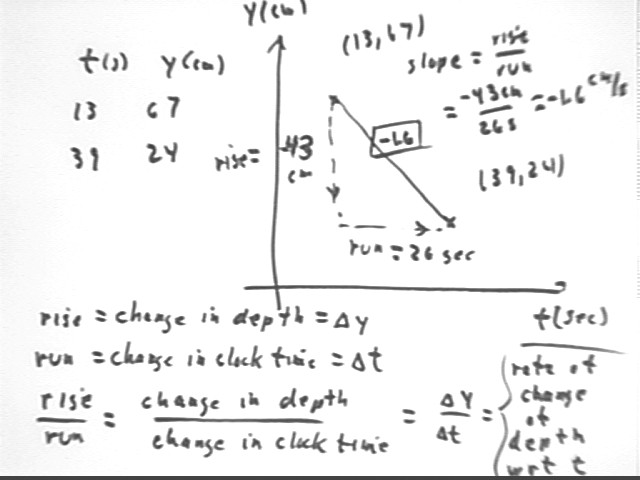
At clock time t = 13 sec the depth of water in a container is 67 cm, while at clock time t = 39 sec the depth is 24 cm. Plot the corresponding points on a graph of depth vs. clock time and determine the slope of the straight line segment connecting these points. Explain why this slope represents the average rate at which the water depth changes over this time interval.
The figure below shows the calculation and the argument.
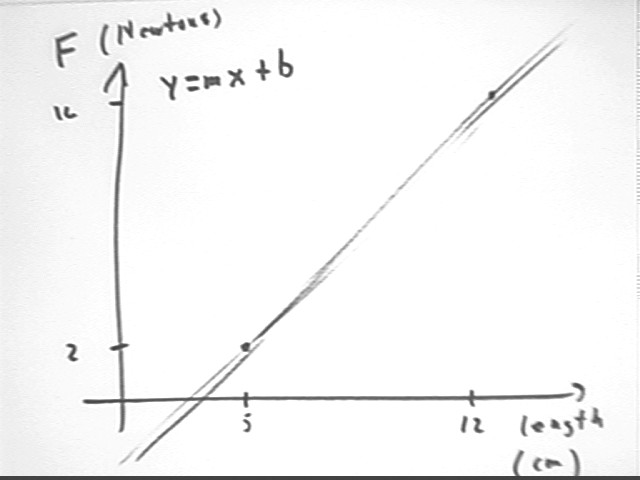
If x stands for the length of a spring in centimeters and y for the force in Newtons exerted by the spring then answer the following:
If the points (5, 2) and (12,16) lie on a graph of y vs. x, what two equations do you get by substituting the coordinates of the points into the form y = m x + b?
Using form y = m x + b we get
Solve these two equations simultaneously to obtain your values of m and b.
Multiplying first equation by -1 and adding we get
Plugging back into 1st equation we get
What is the equation model of your line?
Our model is therefore y = 2 x - 8.
According to your model, what force would be exerted by a spring of length 9 cm?
Our model is y = 2 x - 8.
Since x is the length in cm, we obtain
According to your model, what would be the length of a spring that exerts a force of 11 Newtons?
Our model is y = 2 x - 8.
y stands for force in Newtons so we substitute y = 11.
We get the equation
What is the equation of a line passing through the points (x1, y1) and (x2, y2)? Do this in two ways:
Find the equation by substituting into the form y = m x + b and solving the simultaneous equations for m and b.
See the next figure for standard notation and not that we use, for example, x2 to represent x-sub-2; x2 here does not mean x * 2. Subscripts are not always represented correctly in your browse, and never work in text files so to avoid confusion they aren't used here.
We obtain the equations
y1 = m x1 + b and
y2 = m x2 + b.
We easily solve these equations as indicated in the figure, obtaining
y = (y2 - y1) / (x2 - x1) x + y1 - (y2 - y1) / (x2 - x1) x1.
Construct a graph containing the points (x1, y1) and (x2, y2) and a general point (x, y) on the line.
The graph is shown below.
Write the expression for the slope between (x1, y1) and (x2, y2).
This slope is (y2 - y1) / (x2 - x1), as depicted below.
Write the expression for the slope between (x1, y1) and (x, y).
This slope is (y - y1) / (x - x1), as depicted below.
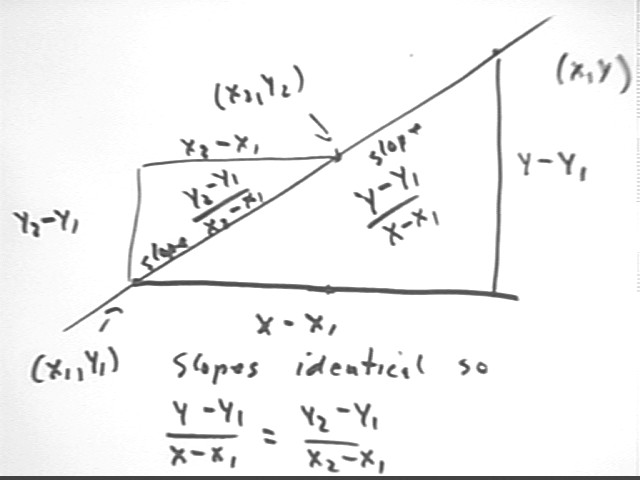
If (x, y) does lie on the line then what can you say about the two slopes for which you just wrote expressions?
The two expressions must be equal, since both slopes are equal to the unchanging slope of the same straight lien.
What equation therefore results?
The resulting equation is