Precalculus I Class 04/03
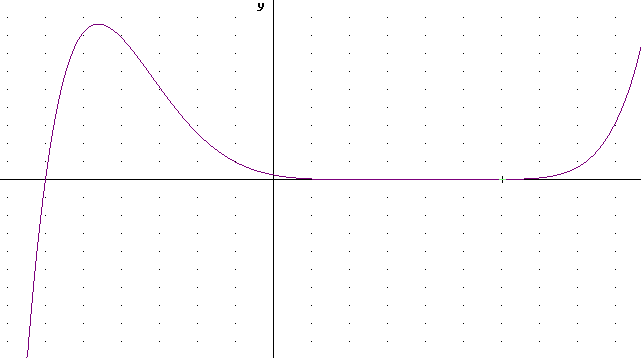
Graph y = (x-2)^2 * (x^2+x+4) * (x+6).
First we find the zeros.
Clearly we have zeros where (x-2) = 0, where (x^2+x+4) = 0 and where (x+6) = 0.
Two of these have obvious solutions, giving us zeros at x = 2 and x = -6.
Let's consider x^2 + x + 4 = 0. This will give us zero if, and only if, x = [ -1 +- sqrt(1^2 - 4 * 1 * 4) ] / ( 2 * 1). Whoa! Look at that discriminant. We get the square root of -15, which just cain't be. So there are no real zeros.
So the only zeros of (x-2)^2 * (x^2+x+4) * (x+6) are 2 and -6. Note that 2 is a second-degree zero.
We note that x^2 + x + 4 is positive for any positive x, and is never zero, so this factor can never become negative.
At far left (x-2) and (x+6) are negative so our y value is a product of 3 negative values (remember x-2 is there twice) and one positive (from the quadratic term). This gives us negative y values.
At far right all factors are positive so the result is positive.
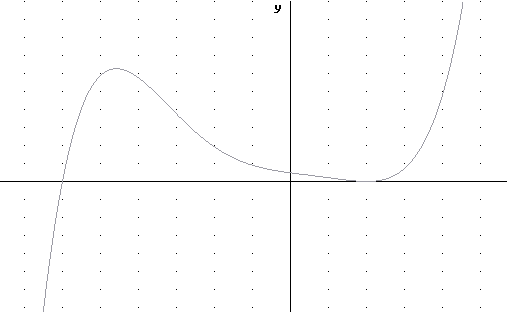
Graph (x-2)^2 * (x^2+4x+1) * (x+6)
First we find the zeros.
Clearly we have zeros where (x-2) = 0, where (x^2+4x+1) = 0 and where (x+6) = 0.
Two of these have obvious solutions, giving us zeros at x = 2 and x = -6.
Let's consider x^2 + 4x + 1 = 0. This will give us zero if, and only if,
x = [ -4 +- sqrt(4^2 - 4 * 1 * 1) ] / ( 2 * 1).
This gives us zeros at
zeros: x = [-4 +sqrt(12)] / 2 and x = [-4 - sqrt(12) ] / 2 or
x = -.27 and x = -3.73, approx.
This means that x^2 + 4 x + 1 factors into (x + .27) ( x + 3.73), approx.
So our function is y = (x-2)^2 (x + .27) ( x + 3.73) (x+6).

What would the graph of y = (x-2)^2 * (x+5) * (x+6)^3 look like?
The graph will have zeros at x = 2, x = -5 and x = -6.
The zero at x = -6 will be of degree 3. It will level off for an instant as it passes thru the x axis, the same way the y = x^3 function levels off for an instant before passing thru the origin.
The zero at x = -5 is of degree 1, so will pass straight through the x axis.
The zero at x = 2 is of degree 2, so will act like a parabola near the point (2, 0).
At far left every factor is negative so the product of all six factors is a large positive number, and far right every factor is positive so the product of all six factors is a large positive number.
Note that the y intercept is 4320. The minimum value between x = -5 and x = -6 doesn't have a chance to get anywhere near this far from the x axis. So we have the choice between showing the detailed behavior near the zeros and showing the y intercept.
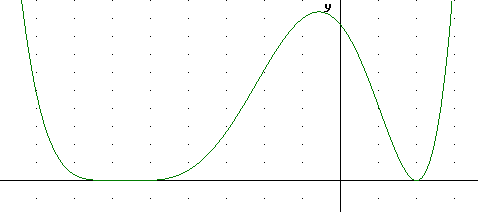
The graph shown below depicts this polynomial on a scale that allows us to see the leveling of the function at the x = -6 intercept and the dip below the x axis before coming back up thru the x = -5 intercept.
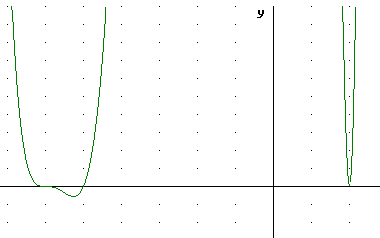
At an expanded y scale the exact locations of the x = -6 and x = -5 zeros is not clear, and we can barely discern the dip below the x axis. Note that the scale still does not show us the y intercept.
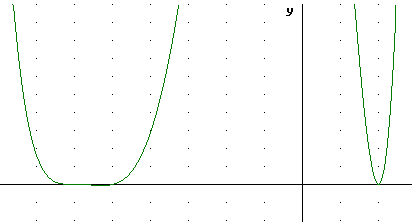
The same function graphed below on a scale that shows the y intercept does not show the relatively tiny dip below the x axis or the detailed behavior at x = -6 and x = -5. This graph appears to show a degree-4 zero somewhere between x = -6 and x = -5.
What would the graph of y = (x-2)^2 * (x-5) * (x+6)^3 look like?
This graph has zeros at x = -6 (a degree 3 zero), x = 2 (a degree 2 zero) and x = 5.
At the degree 3 zero the function levels off at the instant is passes through the x axis. Near the degree 2 zero we have parabolic behavior, and near the degree 1 zero the function is nearly linear.
For large positive x all six factors are positive, giving us a very large positive result.
For large negative x all six factors are negative, giving us a very large positive result.
The graph depicted below shows the behavior near the zeros without showing the max and min points.
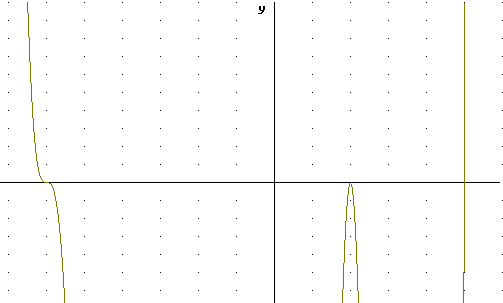
The graph depicted below shows the behavior from the perspective of an expanded y scale.
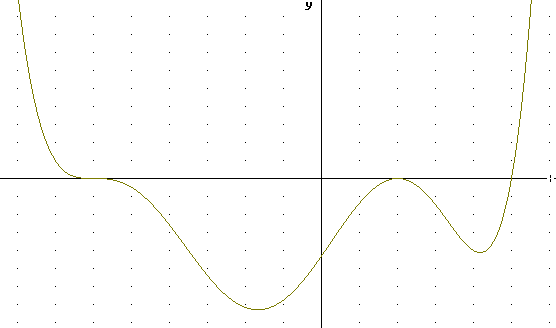
y = (x-2)^2 * (x-5)^4 * (x+6)
The graph below shows the second-degree zero at x = 2, the fourth-degree zero at x = 6 and the first-degree zero at x = -6, but does not show the y-intercept and the relative peak value of the function between x = -6 and x = 2. It's also impossible to tell whether the function is increasing or decreasing for large negative x.
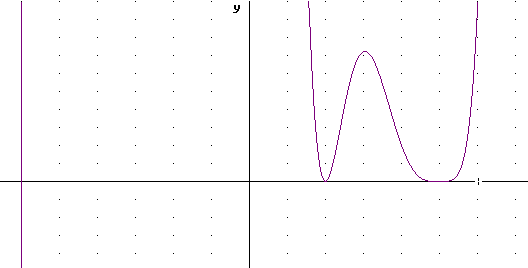
The graph below shows the behavior for large negative x and the relative peak and y-intercept values but the huge expansion required for the y scale obscures the behavior of the function at the other two zeros.
