Most of the 4/17 class was spend in completing the problems on the practice test, found
in the notes here under 4/15.
We then introduced the topic of combining graphs by addition and division.
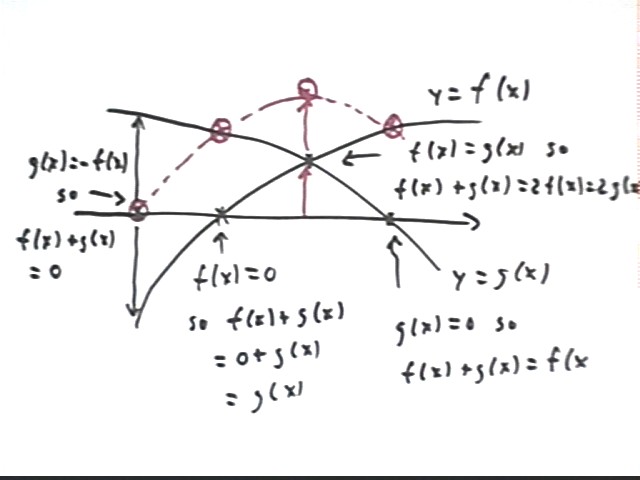
The figure below depicts graphs y = f(x) and y = g(x). We construct the graph of
y = f(x) + g(x) as follows:
We first look for the zeros of both functions. The points where f(x) = 0 and g(x)
= 0 are indicated in the figure.
- When f(x) = 0 it follows that y = f(x) + g(x) = 0 + g(x) = g(x). So at the x value
where f(x) = 0 we know that the graph of y = f(x) + g(x) will coincide with the graph of
g(x). This point is marked with a circled red x, directly above the point where f(x)
= 0.
- When g(x) = 0 it follows that y = f(x) + g(x) = f(x) + 0 = f(x). So at the x value
where g(x) = 0 we know that the graph of y = f(x) + g(x) will coincide with the graph of
f(x). This point is marked with a circled red x, directly above the point where g(x)
= 0.
We then look for points where f(x) and g(x) are equal and opposite--where one function
is as far below the x axis as the other is above.
- There is one such point, near the left side of the figure. At this point f(x) = -
g(x) so f(x) + g(x) = 0.
- We therefore place a cirled red x on the x axis at this point.
We can also look for the points where f(x) = g(x). If the two are equal then f(x)
+ g(x) will be double this common value, equal to 2 f(x) or to 2 g(x).
- The one point where the two functions are equal is located close to the middle of the
graph, where the two curves intersect, and is indicated. The vertical arrows each
have length corresponding to the common value of the two function; the two arrows are
'stacked' to indicate the addition of the two values, and lead to a point twice as far
from the x axis as the intersection point.
We therefore have four points on the graph of the sum y = f(x) + g(x), and these points
appear to give us a good idea of the shape and location of the sum graph. The
approximate sum graph is indicated by the dotted line through the four points.
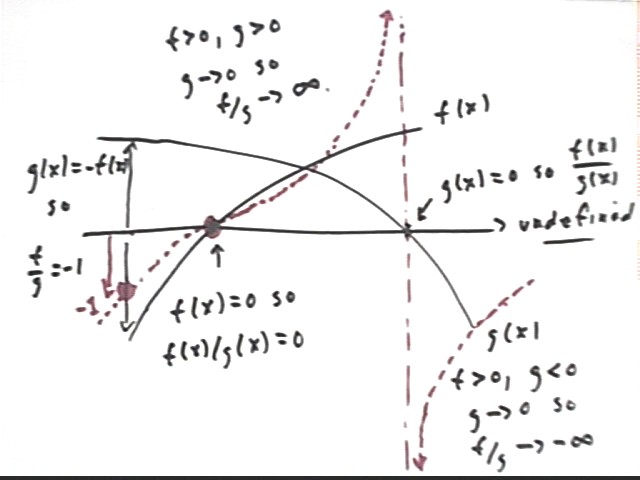
Two very similar functions f(x) and g(x) are sketched below.
This time we want to construct the graph of f(x) / g(x).
We begin by once more looking at the points where one function or another is zero.
- Each function has exactly one zero, as indicated.
- At the point where f(x) = 0 we see that g(x) is not zero so that f(x) / g(x) = 0 / g(x)
= 0. We therefore place a point of the quotient graph at this location.
- At the point where g(x) = 0, f(x) / g(x) is not defined. At this point f(x) is not
zero so that as g(x) approaches zero the magnitude of the quotient will approach infinity,
since roughly speaking smaller and smaller numbers will go into f(x) more and more times.
- To the left of the point where g(x) = 0 both f(x) and g(x) are positive, so f(x) / g(x)
will be positive. From the left, then, f(x) / g(x) will take on positive values of
unlimited magnitude. This results in a vertical asymptote toward which the graph
rises from the left.
- To the right of the point where g(x) = 0, in constrast, f(x) is positive and g(x) is
negative, so f(x) / g(x) will be negative. Approaching the asymptote from the right,
then, f(x) / g(x) will take on negative values of unlimited magnitude. This results
in a vertical asymptote which rises from extreme negative values as we move to the right
of the asymptote.
We then look for x values where the graphs are either equal or equal and opposite.
- The graphs are equal and opposite at the indicated location near the left side of the
figure.
- Whereas the sum graph is zero when f(x) = -g(x), the quotient graph takes value f(x) /
g(x) = -g(x) / g(x) = -1. We indicate this value by a large dot.