Precalculus I Class 04/29
We start with 1 pair of matched baby rabbits.
It takes a month for a pair of baby rabbits to become sexually mature.
A pair of rabbits which are sexually mature at the beginning of one month will produce a matched pair of sexually mature baby rabbits at the beginning of the next month, and for every month thereafter.
Rabbits never die.
How many pair will there be at the end of each of the first 10 months?
| Month | # baby pairs | # mature pairs | total # pairs |
| 0 | 1 | 0 | 1 |
| 1 | 0 | 1 | 1 |
| 2 | 1 | 1 | 2 |
| 3 | 1 | 2 | 3 |
| 4 | 2 | 3 | 5 |
| 5 | 3 | 5 | 8 |
| 6 | 5 | 8 | 13 |
| 7 | 8 | 13 | 21 |
| 8 | 13 | 21 | 34 |
| 9 | 21 | 34 | 55 |
| . . . | . . . | . . . | . . . |
| n-2 | a(n-2) | ||
| n-1 | a(n-2) | a(n-1) | |
| n | a(n-2) | a(n-1) | a(n) |
Our conclusion is that the rule for the sequence is
The meaning is that
A more extensive table is shown below:
| month | immature | mature | total | ratio of seq |
| 0 | 1 | 1 | 1 | |
| 1 | 1 | 1 | 1 | 1 |
| 2 | 1 | 1 | 2 | 2 |
| 3 | 1 | 2 | 3 | 1.5 |
| 4 | 2 | 3 | 5 | 1.67 |
| 5 | 3 | 5 | 8 | 1.6 |
| 6 | 5 | 8 | 13 | 1.625 |
| 7 | 8 | 13 | 21 | 1.615384615 |
| 8 | 13 | 21 | 34 | 1.619047619 |
| 9 | 21 | 34 | 55 | 1.617647059 |
| 10 | 34 | 55 | 89 | 1.618181818 |
| 11 | 55 | 89 | 144 | 1.617977528 |
| 12 | 89 | 144 | 233 | 1.618055556 |
| 13 | 144 | 233 | 377 | 1.618025751 |
| 14 | 233 | 377 | 610 | 1.618037135 |
| 15 | 377 | 610 | 987 | 1.618032787 |
| 16 | 610 | 987 | 1597 | 1.618034448 |
| 17 | 987 | 1597 | 2584 | 1.618033813 |
| 18 | 1597 | 2584 | 4181 | 1.618034056 |
| 19 | 2584 | 4181 | 6765 | 1.618033963 |
| 20 | 4181 | 6765 | 10946 | 1.618033999 |
| 21 | 6765 | 10946 | 17711 | 1.618033985 |
| 22 | 10946 | 17711 | 28657 | 1.61803399 |
| 23 | 17711 | 28657 | 46368 | 1.618033988 |
| 24 | 28657 | 46368 | 75025 | 1.618033989 |
| 25 | 46368 | 75025 | 121393 | 1.618033989 |
| 26 | 75025 | 121393 | 196418 | 1.618033989 |
| 27 | 121393 | 196418 | 317811 | 1.618033989 |
| 28 | 196418 | 317811 | 514229 | 1.618033989 |
| 29 | 317811 | 514229 | 832040 | 1.618033989 |
| 30 | 514229 | 832040 | 1346269 | 1.618033989 |
| 31 | 832040 | 1346269 | 2178309 | 1.618033989 |
| 32 | 1346269 | 2178309 | 3524578 | 1.618033989 |
| 33 | 2178309 | 3524578 | 5702887 | 1.618033989 |
| 34 | 3524578 | 5702887 | 9227465 | 1.618033989 |
| 35 | 5702887 | 9227465 | 14930352 | 1.618033989 |
| 36 | 9227465 | 14930352 | 24157817 | 1.618033989 |
| 37 | 14930352 | 24157817 | 39088169 | 1.618033989 |
| 38 | 24157817 | 39088169 | 63245986 | 1.618033989 |
| 39 | 39088169 | 63245986 | 102334155 | 1.618033989 |
| 40 | 63245986 | 102334155 | 165580141 | 1.618033989 |
| 41 | 102334155 | 165580141 | 267914296 | 1.618033989 |
| 42 | 165580141 | 267914296 | 433494437 | 1.618033989 |
| 43 | 267914296 | 433494437 | 701408733 | 1.618033989 |
| 44 | 433494437 | 701408733 | 1134903170 | 1.618033989 |
| 45 | 701408733 | 1134903170 | 1836311903 | 1.618033989 |
| 46 | 1134903170 | 1836311903 | 2971215073 | 1.618033989 |
| 47 | 1836311903 | 2971215073 | 4807526976 | 1.618033989 |
The ratios of the sequence are found by dividing each total by the preceding total. The sequence of totals is 1, 1, 2, 3, 5, 8, 13, ... and the ratios are 1/1 = 1, 2/1 = 2; 3/2 = 1.5; 5/3 = 1.6, etc..
We note that the ratios appear to approach a limit which to 10 significant figures is 1.618033989. Recalling that a constant ratio is a characteristic of an exponential function we hypothesize that this sequence can be approximated by an exponential function and move to Excel to fit an exponential curve to our results.
The sequence of ratios is plotted below with a vertical scale from 1 to 2. We see how the sequence increases then decrease alternately, with any two consecutive y values 'squeezing' all the subsequent y values between them (e.g., the first two y values are 1 and 2, and all subsequent y values are between 1 and 2; the next two are 2 and 1.5, and all remaining y values are between 2 and 1.5; etc. ).
From this picture we see that the sequence appears to converge to a value a little greater than 1.6.
Plotting the sequence of ratios again, with y values ranging only from 1.4 to 1.8, exaggerates the vertical scale. From this graph we can estimate that the sequence converges to a value around 1.62.
We again plot the sequence with a reduced vertical scale, again showing how the alternately increasing and decreasing behavior of the sequence continues.
This graph shows that the sequence converges to a value slightly less than 1.62.
The convergent value of the sequence is in fact (1+sqrt(5))/2. This is an irrational number, with an infinite number of significant figures. To 10 significant figures this value is 1.618033989; note that the ratios take this 10-significant-figure value starting with the 24th month.
Suppose I take a 1000 mg dose of super-duper-make-ya-better medicine. I take a dose every 6 hours.
In 6 hours I lose 60% of whatever medicine I had in my system just after the previous dose.
So how much do I have just after I take my second dose?
How much do I havc after each of the first 5 doses?
The 1000 mg present just after the first dose decreases by 60%, leaving 40% of the 1000 mg still present. 40% of 1000 mg is 400 mg, so just before the second dose we have 400 mg. Just after the second 1000 mg dose we therefore have 1400 mg.
The 1400 mg present just after the second dose decreases by 60%, leaving 40% of the 1400 mg still present. 40% of 1400 mg is 560 mg, so just before the third dose we have 560 mg. Just after the third 1000 mg dose we therefore have 1560 mg.
The 1560 mg present just after the third dose decreases by 60%, leaving 40% of the 1560 mg still present. 40% of 1560 mg is 624 mg, so just before the fourth dose we have 624 mg. Just after the fourth 1000 mg dose we therefore have 1624 mg.
The same process leads us to the conclusion that just after the fifth dose we have 1649.6 mg.
| dose # | amt after dose | amt just before next dose |
| 1 | 1000 | 400 |
| 2 | 1400 | 560 |
| 3 | 1560 | 624 |
| 4 | 1624 | 649.6 |
| 5 | 1649.6 | 658.6 |
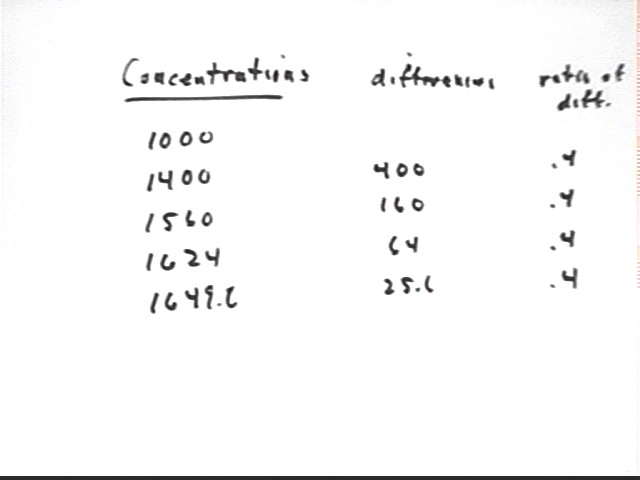
The sequence of amounts in mg is 1000, 1400, 1560, 1624, 1649.6. Is this sequence exponential?
The ratios of the sequence are 1400/1000 = 1.4, 1560 / 1400 = 1.11, 1624/1560 = 1.04, etc.. These ratios are not constant so we cannot conclude from the ratios of the sequence that the sequence is exponential.
A sequence is also exponential if the ratio of its differences is constant. The differences of the sequence are 400, 160, 64 and 25.6. The ratios of these differences are all .4, so the sequence is indeed exponential.
| dose # | amt after dose | differences |
| 1 | 1000 | |
| 2 | 1400 | 400 |
| 3 | 1560 | 160 |
| 4 | 1624 | 64 |
| 5 | 1649.6 | 25.6 |
The convergent value of this sequence is the concentration for which the 60% lost is equal to the 1000 mg taken with each dose. We therefore find the value C such that 60% of C is 1000 mg.
Solving the equation .60 C = 1000 we obtain C = 1000 / .60 = 1666 2/3.
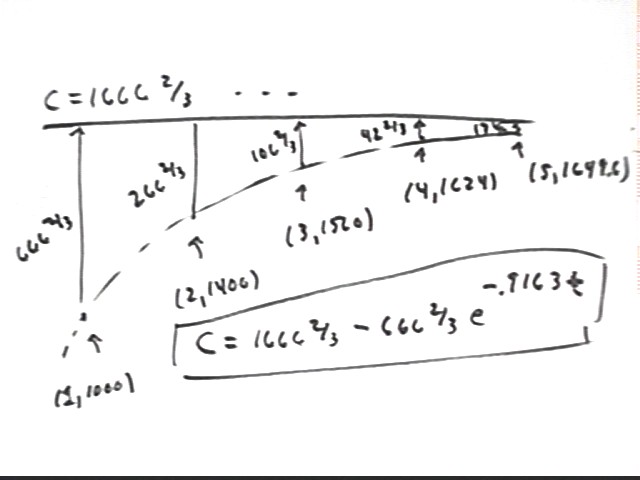
From the figure below we see that the concentrations 1000, 1400, 1520, ... will exponentially approach the asymptote C = 1666 2/3.
If we find the deviations between these concentrations and the asymptotic value C = 1666 2/3 we obtain for doses 1, 2, 3, 4 and 5 the deviations 666 2/3, 266 2/3, 106 2/3, 42 2/3 and 17 1/16.
deviation = 666 2/3 * e^(-.9163(t-1) ) = 666 2/3 * .4^(t-1).
C(t) = 1666 2/3 - 666 2/3 e^(-.9163(t-1) ) = 1666 2/3 - 666 2/3 * .4^(t-1).