Additional Notes on Transformations
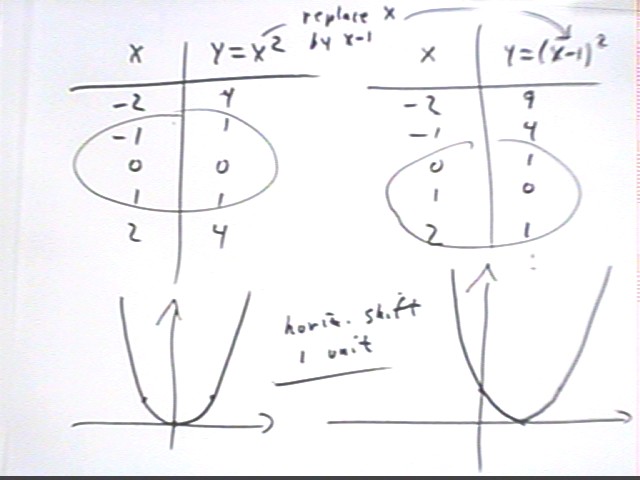
The figure below demonstrates why replacing x by x - 1 shifts the graph +1 unit in the
horizontal direction.
- Note how the number in the y column of the table shift 'ahead' one place when we replace
x by x - 1.
- This will always happen, whatever the function.
- The result is that the graph of the function shifts 'ahead' 1 unit in the x direction.
If we replace x by x - h, the entire table will shift h units in the x direction.
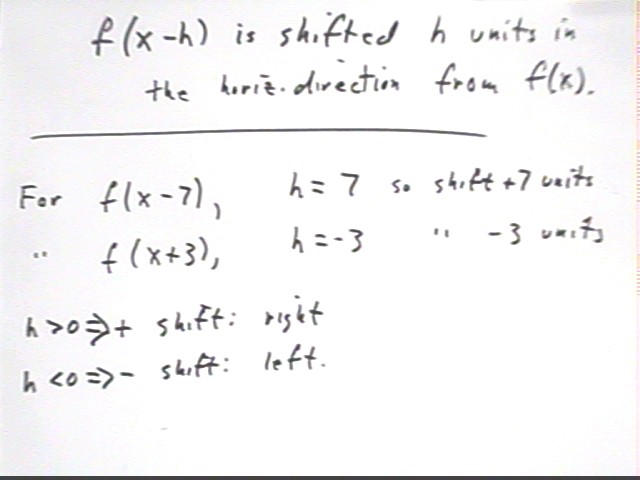
We express the fact that the same thing happens for any function by stating that f(x-h)
is shifted h units in the horizontal direction compared to the graph of f(x).
- If we write f(x-7), then we have f(x-h) for h = 7 and the corresponding graph shifts 7
units in the horizontal direction.
- If we write f(x+3), then since x + 3 = x - (-3) we have written f(x-h) for h = -3 and
the corresponding graph shifts -3 units in the x direction.
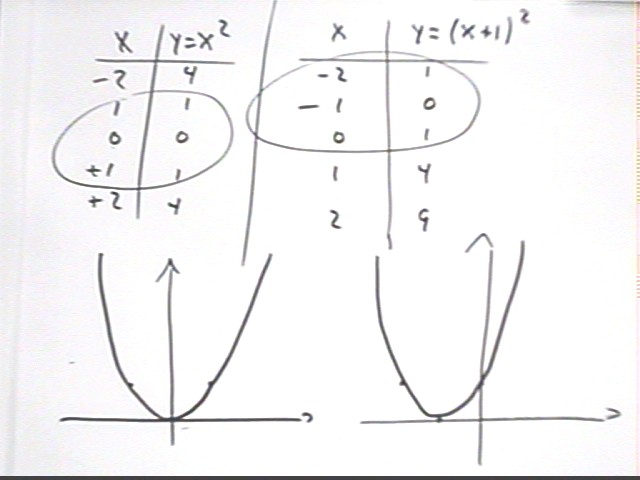
The tables below show why the graph of y = x^2 shifts 1 unit to the left when x is
replaced by x + 1.
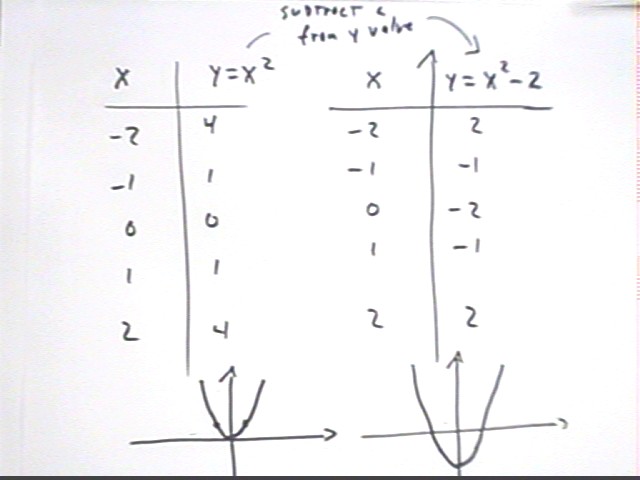
If instead of replacing x by x - h we instead simply add or subtract a number from the
y value, the graph shifts upward or downward. The table below illustrates how this
works for the function y = x^2.
- Compared to y = x^2, the values of y = x^2 - 2 are all 2 units less.
- This shifts the graph 2 units lower.
The same will be true of any function.
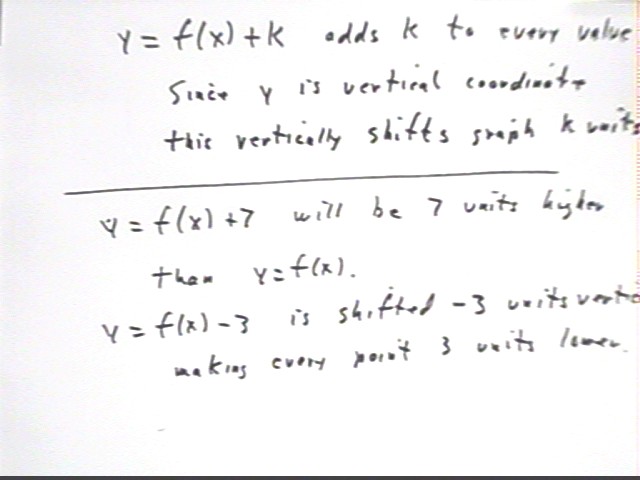
We generalize this behavio by saying that the graph of y = f(x) + k is shifted k units
in the vertical direction, relative to the graph of y = f(x).
- Thus y = f(x) + 7, which is of the form y = f(x) + k for k = 7, is shifted vertically 7
units relative to the graph of y = f(x)
- Similarly the graph of y = f(x) - 3, which is of the form y = f(x) + k for k = -3, is
shifted vertically -3 units relative to the graph of y = f(x).
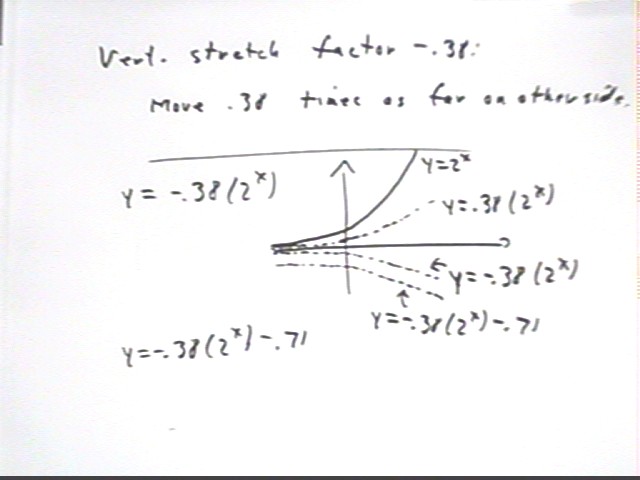
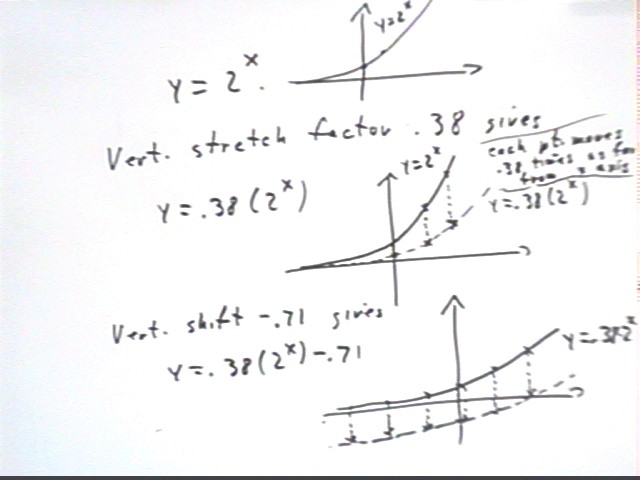
A vertical stretch of a function f(x) by factor A is expressed by mulitplying f(x) by
A, obtaining the function y = A f(x).
- In the example below we apply a vertical stretch by factor .38 to the function y = 2^x.
- This vertical stretch takes every point on the graph of y = 2^x and moves it .38 times
as far from the x axis; this puts every point nearly 3 times closer to the x axis, as
indicated in the figure below.
If we vertically stretch a function f(x) by factor A then vertically shift it k units
the function we obtain is y = A f(x) + k.
- In the figure below we see how, after vertically stretching y = 2^x by factor .38, we
vertically shift it -.71 units.
- Note how the vertical shift moves every point downward by the same amount; note also
that the vertical stretch moved different points through different distances. You
should think about why this is so.
- The resulting function is y = .38 * 2^x - .71.
A vertical stretch by a negative factor moves points to the opposite side of the x
axis.
- We see below the vertical stretch of y = 2^x by factor -.38. We can think of first
stretching by factor .38, obtaining the same graph as before, then multiplying by -1,
which 'flips' the graph over.
- The resulting graph is then vertically shifted -.71 units, resulting in the function y =
-.38 * 2^x - .71.