Assignment Basic Graphs
Make a y vs. x table for the function y = x^2, using x values -3, -2, -1, 0, 1, 2, 3.
| x | y |
| -3 | |
| -2 | |
| -1 | |
| 0 | |
| 1 | |
| 2 | |
| 3 |
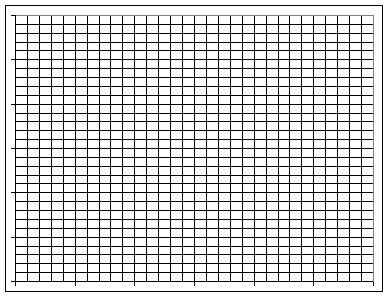
Use the figure below, with an appropriate scale, to sketch the corresponding graph and use the best straight line or smooth curve you can to sketch the shape of the y vs. x graph.
Make a y vs. x table for the function y = 2^x, using x values -3, -2, -1, 0, 1, 2, 3.
| x | y |
| -3 | |
| -2 | |
| -1 | |
| 0 | |
| 1 | |
| 2 | |
| 3 |
Use the figure below, with an appropriate scale, to sketch the corresponding graph and use the best straight line or smooth curve you can to sketch the shape of the y vs. x graph.
Make a y vs. x table for the function y = x, using x values -3, -2, -1, 0, 1, 2, 3.
| x | y |
| -3 | |
| -2 | |
| -1 | |
| 0 | |
| 1 | |
| 2 | |
| 3 |
Use the figure below, with an appropriate scale, to sketch the corresponding graph and use the best straight line or smooth curve you can to sketch the shape of the y vs. x graph.
Make a y vs. x table for the function y = sqrt(x), using x values -3, -2, -1, 0, 1, 2, 3.
| x | y |
| -3 | |
| -2 | |
| -1 | |
| 0 | |
| 1 | |
| 2 | |
| 3 |
Use the figure below, with an appropriate scale, to sketch the corresponding graph and use the best straight line or smooth curve you can to sketch the shape of the y vs. x graph.