class 050709
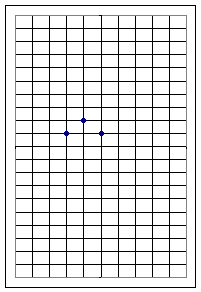
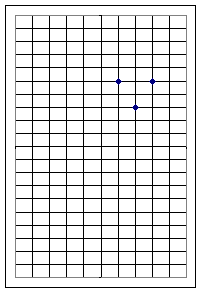
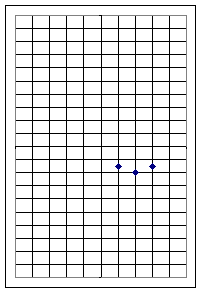
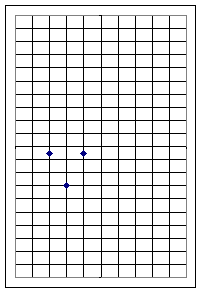
Each of the graphs below depicts three points on the graph of a quadratic function of the form y = a x^2. Every graph has vertex (0, 0).
graph 1

graph 2

graph 3

graph 4

Tables for y = 1/2 x^2, y = -x^2 and y = 2 x^2 are as follows:
| x | y=1/2 x^2 | y=-x^2 | y = 2 x^2 |
| -1 | 1/2 | -1 | 2 |
| 0 | 0 | 0 | 0 |
| 1 | 1/2 | -1 | 2 |
In Graph 1 the points one unit to the right and left of the vertex are displaced -1 units in the y direction from the vertex, matching the behavior of the function y = - x^2.
In Graph 2 the points one unit to the right and left of the vertex are displaced +2 units in the y direction from the vertex, matching the behavior of the function y = 2 x^2.
In Graph 3 the points one unit to the right and left of the vertex are displaced +1/2 units in the y direction from the vertex, matching the behavior of the function y = 1/2 x^2.
In Graph 4 the points one unit to the right and left of the vertex are displaced +2.5 units in the y direction from the vertex, matching the behavior of the function y = 2.5 x^2.
If the x and y axes correspond respectively to the bottom and left edges of the grid then:
For graph 1, the vertex lies at (4, 12).
For graph 2, the vertex lies at (7, 13).
For graph 3, the vertex lies at (7, 8).
For graph 4, the vertex lies at (4, 7).
How would the graph of y = - x^2 have to be shifted to give us a similar parabola whose vertex is (4, 12)?
The vertex of the y = - x^2 parabola is (0, 0), so the y = -x^2 parabola would have to be shifted 4 units to the right and 12 units up.
The shift to the right could be accomplished by replacing x with x - 4 to get the function y = - (x - 4) ^ 2. It's easy to see that if x = 4, this function gives us y = 0, and that x = 3, x = 4 and x = 5 give us y values -1, 0 and -1, as shown in the table below:
| x | x - 4 | y =-(x-4)^2 |
| 3 | -1 | -1 |
| 4 | 0 | 0 |
| 5 | 1 | -1 |
This shifts our 3 basic points to x coordinates x = 3, x = 4 and x = 5.
If we now add 12 to our y values we obtain y = - ( x - 4 ) ^ 2 + 12, which matches our graph:
| x | x - 4 | y =-(x-4)^2 | y =-(x-4)^2 + 12 |
| 3 | -1 | -1 | 11 |
| 4 | 0 | 0 | 12 |
| 5 | 1 | -1 | 11 |
What are the vertex and the graph points 1 unit to the right and left of the axis of symmetry for the function y = 2 x^2 - 8 x + 3? Sketch these three points on the fourth of the above graphs, and based on these points sketch the corresponding parabola.
Questions and Answers:
To find the zeros of a quadratic function do you simply substitute 0 in for the y and then solve for the x?
I am still unsure about the x vs. y concept. Is there a definitive way to know for sure which information should be classified as x or y. Thanks.
I know how ""aX^2"" widens or narrows the parabola in a graph, but how does ""bX"" and ""c"" move the vertex on the graph.
When finding the zeros of the vertex do you substitue zero for y or x or both in the quadratic equation? Will it work if the graph doesnt touch the zero on either axis?
Some of the data sets contain numbers with several decimal places which can become very confusing in an equation, is it possible to round the numbers in the original data set without severely changing the final outcome of the modeling process?
My question is, on the precal homework you assigned on wed., I'm having some trouble finding the vertex, like on finding the vertex and graphing y=x^2+x+1 I used the formula (-b)/(2a) to find the vertex coordinate x. my a = 1 b=1 c=1 then my first thing would to be divide -(1)/(2(1)) This would be -(1/2) which would equal my x coordinate then I substitute the x coordinate into y=x^2+x+1 for x and find y to be (7/4)
Then I am confused on how to find my unit to the left and my unit to the right, I was just wondering whether I did this right, I read over the worksheets, but I'm still confused. Thanks
I have a question about problem 2 on exercise 1-3(Graphs
of Quadratic Functions) it is the last part of the question where it says
...Sketch the graph of each function, based only on the 3 points you have
sketched and your knowledge that the graph is a parabola... I dont understand
what to do because the question up from that one kinda answers that question
also. What do I do differently in that question than I did in the previous
question?
One question asks you to graph the three points. The other asks you to sketch
the curve based on those three points.
I also have a question about #4 on that same worksheet...If you were to draw a
smooth curve passing through the vertex of each of the first four graphs, what
can you say about the shape of the curve?...What do you want to know about them?
The only thing that I can see is that they are all four turning upward....is
that all I need to say?
Your statement that 'they are all four turning upward' is a little ambiguous.
It states that every point is turning upward, and a point can't turn upward. You
might either mean that the trend of the curve through the vertices is turning
upward, or you might mean that every graph is turning upward.
Don't give it away, but I'll tell you that the curve through those vertices is
itself a parabola. We'll look at it more closely in class.
One of the instructions was to graph 3 points: the vertex, one point to the
right and one to the left of the vertex. To graph the 2 points to the right and
left of the vertex, all you do is move one to either the left or right and then
up whatever spaces that ""a"" equals to right?
Exactly. Good question, which you answered yourself.