
class 050921
Briefly, to take your test go to the Learning Lab, go to a computer and do the following:
Go to your homepage at http://vhmthphy.vhcc.edu/ and
click on Tests.
Print off the test.
Get it signed by the attendant.
Take it in the room to which the attendant directs you.
Hand it to the attendant.
No calculators are to be used for the following:
1. (2 minute time limit)
Make tables and sketch graphs of y = f(x) for each of the following functions, using the basic points for that function.


2. (2 minute time limit)
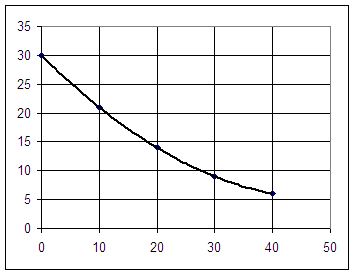
The graph below represents water depth in cm vs. clock time in seconds.

Based on the graph
3. For the function y = f(t) = 2 t^2 - 3, what is the value of ( f(t2) - f(t1) ) / ( t2 - t1) for t1 = 1 and t2 = 3?
Simple Power Function Form: y = A x ^ p.
Quadratic Function Form: y = a t^2 + b t + c
Quadratic Function Characteristics: Vertex on axis of symmetry at t = -b / (2 a). Move 1 unit right or left and vertical displacement is a units.
Given any function y = f(t) then
Given basic function y = f(x), then
The behavior of the function is easily traced by observing the effects of these transformations on the function's basic points.
Time and Date Stamps (logged): 10:12:00 09-19-2005 °¯Ÿ°±Ÿ¯¯¯¸Ÿ°¸Ÿ±¯¯´
Problem Number 1
Problem: Obtain a quadratic depth vs. clock time model if depths of 80.93887 cm, 68.64622 cm and 62.12207 cm are observed clock times t = 12.32081, 24.64162 and 36.96243 seconds.
Problem: The quadratic depth vs. clock time model corresponding to depths of 80.93887 cm, 68.64622 cm and 62.12207 cm at clock times t = 12.32081, 24.64162 and 36.96243 seconds is depth(t) = .019 t2 + -1.7 t + 99. Use the model to determine whether the depth will ever reach zero.
Problem Number 2
Problem: If we apply a vertical stretch by factor .79 then a vertical shift of -2.04 units to the graph of the basic exponential function y = 2 x, what is the algebraic form of the function obtained? Sketch a graph of this new function, and show that the graph is different than that obtained if the vertical shift is performed before the vertical stretch.
Problem: At clock times t = 12, 24, 36 and 48 seconds, the depth of water in a uniform cylinder was observed to be 58.224, 44.496, 36.816 and 35.184 cm. At what average rate does the depth change during each of the three time intervals? Predict, based on your calculated rates, what the next average rate would be. Based on your prediction, what will be the depth at t = 60 seconds?
Problem Number 3
Sketch a graph of y = x^2, from x = -3 to x = 3. Then sketch a graph of y = .25 x^2 over the same domain.
Sketch the second graph shifted 1.75 units in the x direction and .75 units in the y direction.
What are the three basic points of this graph?
If f(x) = x^2, then what are
Problem Number 4
If f(x) = x2, give the vertex and the three basic points of the graphs of f(x--.25), f(x) - .35, 2 f(x) and 2 f(x--.25) + .35. Quickly sketch each graph.
If water depths of -66.4, -108, -136.2 and -150.9 cm are observed at clock times 51.8, 77.7, 103.6 and 129.5 sec, then at what average rate does the depth change during each time interval?
Sketch a graph of this data set and use a sketch to explain why the slope of this graph between 77.7 and 103.6 sec represents the average rate at which depth changes during this time interval.
Problem Number 5
At clock time t = 12 sec the depth of water in a container is 60 cm, while at clock time t = 34 sec the depth is 30 cm. Plot the corresponding points on a graph of depth vs. clock time and determine the slope of the straight line segment connecting these points. Explain why this slope represents the average rate at which the water depth changes over this time interval.
For the quadratic function y = f(t) = .018 t2 + -2.18 t + 84, determine the average rate of change of y with respect to t, between clock times t = 34 and t = 40.