class 050923
Note the Access link 23-24-242 containing all questions asked
to date, with answers.
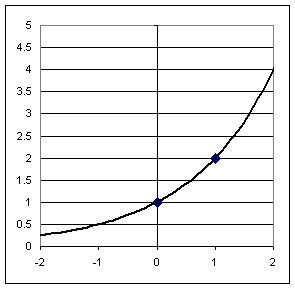
The graph below represents the basic exponential function y =
f(x) = 2^x. The basic points of the graph are clearly shown.
- What would be the corresponding basic points of the graph
of y = 2 f(x)? Sketch them and indicate each with a cross: X. Then
sketch the graph of y = 2 f(x).
- What would be the corresponding basic points of the graph
of y = f ( x - 2)? Sketch these points and indicate each with a small
circle o. Then sketch the graph of y = f(x - 2).
- What would be the corresponding basic points of the graph
of y = f ( x ) - 2? Sketch these points and indicate each with a
small vee: v. Then sketch the graph of y = f(x) - 2.
The graph below represents the behavior of the graph of y =
f(x) = x^-2 for x > 0. Basic points are shown.
- Sketch the rest of the graph, the part corresponding to x <
0. Show the corresponding basic points on this part of the graph also.
- Sketch the graph of y = .5 f(x - 1) - 3.
Time and Date Stamps (logged): 10:12:00 09-19-2005 °¯Ÿ°±Ÿ¯¯¯¸Ÿ°¸Ÿ±¯¯´
Precalculus I Major Quiz
Test should be printed using Internet
Explorer. If printed from different browser check to be sure test items have
not been cut off. If items are cut off then print in Landscape Mode (choose
File, Print, click on Properties and check the box next to Landscape, etc.).
- Write on ONE SIDE of paper only
- If a distance student be sure to
email instructor after taking the test in order to request results.
Name and Signature of Student
_____________________________
Signed by Attendant, with Current Date and
Time: ______________________
If picture ID has been matched with student and
name as given above, Attendant please sign here: _________
Instructions:
- Test is to be taken without reference
to text or outside notes.
- Graphing Calculator is allowed, as is
blank paper or testing center paper.
- No time limit but test is to be taken
in one sitting.
- Please place completed test in Dave
Smith's folder, OR mail to Dave Smith, Science and Engineering, Va. Highlands
CC, Abingdon, Va., 24212-0828 OR email copy of document to
dsmith@vhcc.edu, OR fax to 276-739-2590.
Test must be returned by individual or agency supervising test. Test is not to
be returned to student after it has been taken. Student may, if proctor deems
it feasible, make and retain a copy of the test..
Directions for Student:
- Completely document your work.
- Numerical answers should be correct to
3 significant figures. You may round off given numerical information to a
precision consistent with this standard.
- Undocumented and unjustified answers
may be counted wrong, and in the case of two-choice or limited-choice answers
(e.g., true-false or yes-no) will be counted wrong. Undocumented and
unjustified answers, if wrong, never get partial credit.
So show your
work and explain your reasoning.
- Due to a scanner malfunction and other
errors some test items may be hard to read, incomplete or even illegible. If
this is judged by the instructor to be the case you will not be penalized for
these items, but if you complete them and if they help your grade they will be
counted. Therefore it is to your advantage to attempt to complete them, if
necessary sensibly filling in any questionable parts.
- Please write on one side of paper
only, and staple test pages together.
Test Problems:
Problem Number 1
Problem: Obtain a quadratic depth vs. clock time model if depths of 80.93887
cm, 68.64622 cm and 62.12207 cm are observed clock times t = 12.32081, 24.64162
and 36.96243 seconds.
Problem: The quadratic depth vs. clock time model corresponding to depths of
80.93887 cm, 68.64622 cm and 62.12207 cm at clock times t = 12.32081, 24.64162
and 36.96243 seconds is depth(t) = .019 t2 + -1.7 t + 99. Use the
model to determine whether the depth will ever reach zero.
Problem Number 2
Problem: If we apply a vertical stretch by factor .79 then a vertical shift
of -2.04 units to the graph of the basic exponential function y = 2 x,
what is the algebraic form of the function obtained? Sketch a graph of this new
function, and show that the graph is different than that obtained if the
vertical shift is performed before the vertical stretch.
Problem: At clock times t = 12, 24, 36 and 48 seconds, the depth of water in
a uniform cylinder was observed to be 58.224, 44.496, 36.816 and 35.184 cm. At
what average rate does the depth change during each of the three time intervals?
Predict, based on your calculated rates, what the next average rate would be.
Based on your prediction, what will be the depth at t = 60 seconds?
Problem Number 3
Sketch a graph of y = x^2, from x = -3 to x = 3. Then sketch a graph of y =
.25 x^2 over the same domain.
- By what factor do we
vertically stretch the first graph to obtain the second?
- What are the three
basic points of the first graph (i.e., the vertex and the points 1 unit to the
right and left of the vertex)?
- What are the three
basic points of the second graph?
Sketch the second graph
shifted 1.75 units in the x direction and .75 units in the y direction.
What are the three
basic points of this graph?
If f(x) = x^2, then what are
- f(x- 1.75), f(x)
+ .75, .25 f(x) and .25 f(x- 1.75) + .75?
Problem Number 4
If f(x) = x2, give the vertex and the three basic points of the
graphs of f(x--.25), f(x) - .35, 2 f(x) and 2 f(x--.25) + .35. Quickly sketch
each graph.
If water depths of -66.4, -108, -136.2 and -150.9 cm are observed at clock
times 51.8, 77.7, 103.6 and 129.5 sec, then at what average rate does the depth
change during each time interval?
Sketch a graph of this data set and use a sketch to explain why the slope of
this graph between 77.7 and 103.6 sec represents the average rate at which depth
changes during this time interval.
Problem Number 5
At clock time t = 12 sec the depth of water in a container is 60 cm, while at
clock time t = 34 sec the depth is 30 cm. Plot the corresponding points on a
graph of depth vs. clock time and determine the slope of the straight line
segment connecting these points. Explain why this slope represents the average
rate at which the water depth changes over this time interval.
For the quadratic function y = f(t) = .018 t2 + -2.18 t + 84,
determine the average rate of change of y with respect to t, between clock times
t = 34 and t = 40.