For depth vs. clock time observations:
Table, based on average of class observations:
| clock time | position |
| 0 | 15 |
| 4 | 13 |
| 7 | 11 |
| 11 | 9 |
| 14 | 7 |
| 19 | 5 |
| 25 | 3 |
| 31 | 1 |
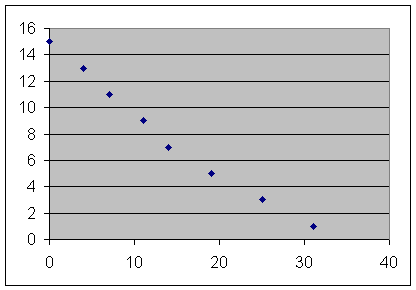
Point graph of depth vs. clock time (note that depth is on vertical axis, clock time on horizontal, as dictated by the language 'depth vs. clock time')::

Your first equation will use t = 5. If your depth estimate, based on a smooth curve thru the data points (NOT on actual data points), is y = 12 cm then the equation for this first point would be
12 = a * 5^2 + b*5 + c or
If the estimate for the t = 15 depth is 6 cm then we get the equation
Using estimated depth 1 cm for t = 30 sec we get the equation
We now have three simultaneous equations in a, b and c.
We can solve these equations for a, b and c by elimination.
The result is
Plugging these values into the form y = a t^2 + b t + c we get the model
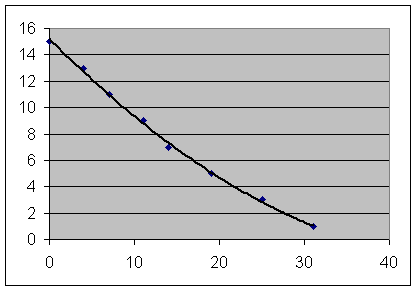
We can graph this equation using Excel, and we can then construct a scatter graph of y vs. t. If we then right-click on a data point and choose Add Trendline, then choose a polynomial of degree 2 (and also click on Options > Display Equation of Graph), we will obtain a quadratic trendline with the 'best-fit' equation.
The Excel trendline gives us the model:
Excel graph:

If the model is
then at what clock time will the depth be 10 cm?
Plug in 10 for y and you get
We will solve this equation using the Quadratic Formula.
Assignment: Use the sheets handed out in class, or go to http://vhmthphy.vhcc.edu > Precalculus > Assts and look at Assignments 1 and 2 which give you links to the following:
You can also refer if you need additional explanations to Class Notes #2 under the Lectures link.