Note that instructions for accessing a 'practice/quiz' program are given at the end of this page.
Quiz 0913
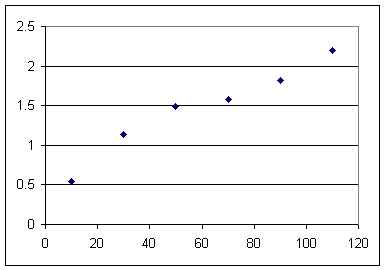
The graph below indicates observations made of pendulum period vs. length.
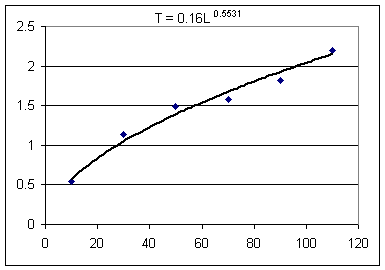
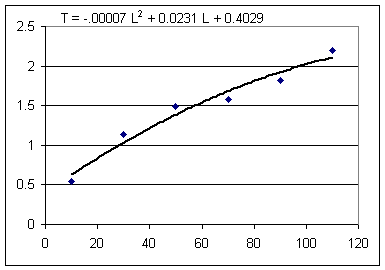
Below the two figures you see two models, one quadratic and the other a power-function model.


1. What is the prediction of each model for length 110 and by how much does this prediction differ from the value observed for length 110?
The first model is T = .16 L ^ .55. This is a power-function model, which we will denote in function notation as
The second is T = -.00007 L^2 + .023 L + .40. This is a quadratic model, which we will denote in function notation as
A quick look at the graph shows us that for length 110 both curves lie slightly above the T = 2 line.
Plugging in L = 110 we get
Both of these results are compatible with the observation that both curves appear to lie slightly above the T = 2 line when L = 110.
What is the percent discrepancy between each model and the observed period for length 110 cm?
The graph indicates a point at (110, 2.2), approximately, so for length 110 cm the observation is that T = 2.2 sec.
The power-function model gives prediction 2.12 sec, which differs from the observation by 2.2 sec - 2.12 sec = .08 sec. As a proportion of the prediction this is .08 / (2.12) = .04, approx, or about a 4% discrepancy.
The quadratic model gives prediction 2.08 sec, which differs from the observation by 2.2 sec - 2.08 sec = .12 sec. As a proportion of the prediction this is .12 / (2.08) = .06, approx, or about a 6% discrepancy.
2. Which model appears to fit the data better, in terms of coming closer on the average to the observed values?
The quadratic model is not significantly closer than the power-function model for any of the lengths L = 30, 50, 70 and 90 cm, and is significantly further for the L = 10 cm and L = 110 cm lengths. So the power-function model fits better.
Using the graph of whichever model you think is better estimate the length that will give period .80 seconds.
From the graphs we start at the T = .80 point on the vertical axis, project horizontally to the curve, the project vertically down to the horizontal axis. In both cases we hit the horizontal axis somewhere close to L = 20 cm.
Using whichever model you think is better estimate the length that will give period .80 seconds.
The power-function model is closer, so period .80 seconds gives us
.80 = .16 * L^.55. Dividing both sides by .16 we get
L^.55 = .80 / .16 = 5, or just
L^.55 = 5. Taking the 1 / .55 power of both sides we get
(L^.55)^(1/.55) = 5 ^(1/.55), which gives us
L^(.55 * 1 / .55) = 18.7, giving us
L^1 = 18.7 or just
L = 18.7.
meaning that the length would be 18.7 cm.
Had we used the quadratic model we would have obtained the equation
.80 = -.00007 L^2 + .023 L + .40, which we would rearrange to
-.00007 L^2 + .023 L - .40 = 0. Applying the quadratic formula this would give us
L = 18.4 or L = 310.
We reject the second solution and conclude that the quadratic model gives us L = 18.4 cm for period .80 sec.
3. For the quadratic model given above:
The graph is a parabola, as is the case for any quadratic function.
The vertex of the parabola T = a L^2 + b L + c is at
For T = -.00007 L^2 + .023 L + .40 the vertex is at
The corresponding value of T is
indicating period 2.28 sec for L = 165 cm.
Note that this isn't a very good model of what actually happens. The quadratic model starts going below the data points at L = 110 and goes further and further below as L increases.
The zeros of the parabola T_quadr(L) = a L^2 + b L + c occur when T = 0, at L = (-b +- sqrt(b^2 - 4 a c) / (2 a).
Substituting for a, b and c we obtain values L = 345.1284128 and L = -16.5569843.
4. What are the graph points which lie on the curve 1 unit to the right and 1 unit to the left of the vertex of the quadratic model?
5. For the quadratic model we have T ( 100 ) = 2.0129. What is the meaning of the 100 and what is the meaning of the 2.0129?
For the quadratic model the equation T(L) = .70 has as one of its solutions the number 13.4. What is the meaning of the .70 and what is the meaning of the 13.4?