Note that instructions for accessing a 'practice/quiz' program are given at the end of this page.
Quiz 0915
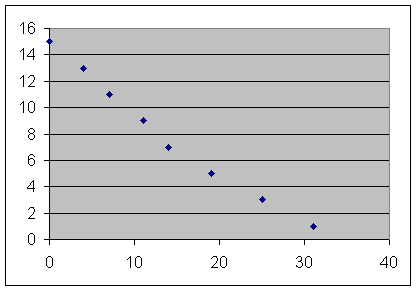
The depth vs. clock time data observed by the class for water flowing from a 3-liter bottle gave us the following graph:

Excel gave us the best-fit model y = 0.0062 t^2 - 0.6497 t + 15.21.
1. To two significant figures, what are the coordinates of the vertex of the quadratic model
obtained from class observations of depth vs. clock time as water flowed out of the 3-liter bottle?
The vertex is located at
The y coordinate of the vertex is
So the coordinates of the vertex are (52, -2.03).
2. What is the meaning of the coordinates of the vertex of that model? What does each coordinate tell you, and what do the coordinates together tell you?
The y coordinate of a point is the depth and the t coordinate is the clock time at which that depth occurs. So the vertex tells us that depth -2.03 cm occurs at clock time t =52 seconds.
The vertex tells us even more. The vertex gives us either the maximum or the minimum possible y coordinate. In this case we know that the y(t) vs. t parabola opens upward, so the vertex gives us the minimum possible y coordinate.
In terms of the bottle this will be the y coordinate of the hole from which water was flowing.
An actual measurement the bottle indicates that the hole is located at y = -3.3 cm, which means that our prediction was a little off but not too bad.
3. According to this model, if we let the water continue to flow out of the bottle would the depth ever be zero? If so at what clock time would this occur?
The y coordinate will be zero provided
which will occur when
To 2 significant figures the quadratic formula tells us that this occurs when t = 34 and when t = 71.
The t = 34 corresponds to the real-world situation, telling us that we would expect to reach the y = 0 point at t = 34 seconds.
4. What are the graph points which lie on the curve 1 unit to the right and 1 unit to the left of the vertex of this model?
The vertex is at (52, -2.03). The coefficient of t^2 is .0062, so we would expect the graph points to be (52-1, -2.03 + .0062) and (52 + 1, -2.03 + .0062), or (51, -2.024) and (53, -2.024).
5. At what clock time would depth have reached 4 cm, according to the model. Is this consistent with the graph?
Depth is 4 when
This gives us a quadratic equation, which we solve to get
We choose t = 21 sec as the solution that corresponds to our experiment.
6. What are the depths predicted by the model for t = 10 sec and for t = 20 sec. At what average rate does the depth change with respect to clock time during this interval?
At t = 10 sec we get
and at t = 20 sec we get
corresponding to respective depths 9.12 cm and 4.48 cm.
So the change in depth is
corresponding to a depth change of -4.64 cm.
The average rate of depth change with respect to clock time is
7. According to the model, what is the average rate of change of depth with respect to clock time for the 1-second interval centered at t = 15 sec?
At t = 14.5 sec we get y(14.5) = 6.88, and at t = 15.5 sec set get y(15.5) = 6.41, corresponding to respective depths 6.88 cm and 6.41 cm.
So the change in depth is y(15.5) - y(14.5) = 6.41 cm - 6.88 cm = -.464 cm, corresponding to a depth change of -.464 cm.
The average rate of depth change with respect to clock time is
8. If you drew a straight line segment between the t = 10 sec and t = 20 sec points of the parabola representing the model, what would be the slope of that segment?
The graph would connect the points (10, 9.12) and (20, 4.48).
[9.12, 4.48, -4.64, 6.87855, 6.41455, -0.464]
The rise 4.48 - 9.12 = -4.64 of the line gives us the change in depth and the run 20 - 10 = 10 gives us the change in clock time.
So the slope of the graph gives us the average rate of change of depth with respect to clock time.
9. What are the values of y(10) and y(10.3)?
10. It you calculate ( y(10.3) - y(10) ) / ( 10.3 - 10) what do you get, and what is the meaning of this result?
11. On the given graph of depth vs. clock time observations, sketch the t = 0, t = 1, t = 2, t = 3 and t = 4 points of the basic quadratic fuction y = x^2. In what ways does the graph of y = x^2 differ from the graph of y(t) = 0.0062 t^2 - 0.6497 t + 15.21?
Note: The To Be Memorized link now includes Properties of a Quadratic Function, as listed below.
1. Quadratic Functions have the form y(x) = a x^2 + b x + c.
2. The graph of a quadratic function is a parabola.
3. The parabola is symmetric about its vertical axis of symmetry.
4. The vertex is the extreme point of the parabola and lies on the axis of symmetry.
5. The zeros of the function lie at x = (-b +- sqrt(b^2 - 4 a c) ) / (2a).
6. The axis of symmetry of the function is the line x = - b / (2 a), which lies halfway between the zeros as long as the function has real zeros.