Class 040920
At the computer:
Using the program h:\shares\physics\mcg run the program. When asked for course number enter the word 'quizzes'.
Run the program and do as it says. Type in your VCCS login name, if you know it, and if not just type in your first initial and last name (no punctuation). Then type in quizzes for your course.
The sequence of buttons is Next Question, Display Choices, Enter Answer and See Results, or something very much like that.
On paper:
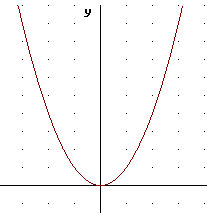
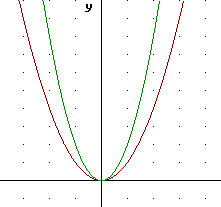
On the graph of y = x^2 below sketch a graph of y = 2 x^2. Make a table at right.
The table is as shown below.
| y | y=x^2 | y=2x^2 |
| -3 | 9 | 18 |
| -2 | 4 | 8 |
| -1 | 1 | 2 |
| 0 | 0 | 0 |
| 1 | 1 | 2 |
| 2 | 4 | 8 |
| 3 | 9 | 18 |
The y values of y = 2 x^2 are seen to be double the y values of y = x^2, for reasons that should be clear.
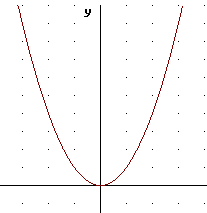
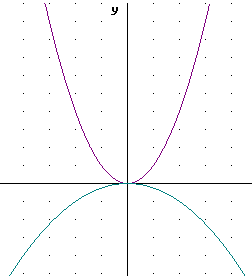
The first graph shows y = x^2 vs. x, the second shows both y = x^2 and y = 2 x^2.


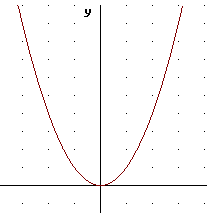
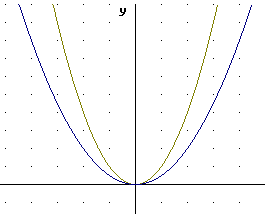
On the graph of y = x^2 below sketch a graph of y = 1/2 x^2. Make a table at right.
| y | y=x^2 | y=1/2 * x^2 |
| -3 | 9 | 4.5 |
| -2 | 4 | 2 |
| -1 | 1 | 0.5 |
| 0 | 0 | 0 |
| 1 | 1 | 0.5 |
| 2 | 4 | 2 |
| 3 | 9 | 4.5 |
The table above and the graph below show how the graph of y = 1/2 x^2 moves each point of the y = x^2 graph twice as close to the x axis. This can be thought of as a vertical stretch by factor 1/2; since the factor is less than 1 this amounts to a vertical compression. Each point of the y = x^2 graph moves to a position 1/2 as far from (i.e., twice as closeto ) the x axis.
On the graph of y = x^2 below sketch a graph of y = -1/4 x^2. Make a table at right.
| y | y=x^2 | y=-1/4 * x^2 |
| -3 | 9 | -2.25 |
| -2 | 4 | -1 |
| -1 | 1 | -0.25 |
| 0 | 0 | 0 |
| 1 | 1 | -0.25 |
| 2 | 4 | -1 |
| 3 | 9 | -2.25 |
The table above and the graph below show how the graph of y = -1/4 x^2 moves each point of the y = x^2 graph four times as close to the x axis, and also 'flips' the graph around to the other side of the x axis. This can be thought of as a vertical stretch by factor -1/4; since the magnitude of the factor is less than 1 this amounts to a vertical compression, and since the factor is negative the graph is also 'flipped' about the x axis. Each point of the y = x^2 graph moves to a position 1/4 as far from (i.e., four times as close to) the x axis, and on the other side of the x axis.
On the graph of y = x^2 below sketch a graph of y = 2 ( x - 1)^2. Make a table at right.
| y | y=x^2 | y = 2 x^2 | y=2 * (x-1)^2 |
| -3 | 9 | 18 | 32 |
| -2 | 4 | 8 | 18 |
| -1 | 1 | 2 | 8 |
| 0 | 0 | 0 | 2 |
| 1 | 1 | 2 | 0 |
| 2 | 4 | 8 | 2 |
| 3 | 9 | 18 | 8 |
The table shows how the graph of y = 2 ( x - 1) ^ 2 is related to that of y = 2 x^2.
Since x is replaced by x - 1, in order to get a given y value the value of x must be 1 greater. So for example, y = 2 x^2 is 0 at x = 0, but y = 2 ( x - 1 ) ^ 2 is zero at x = 1. Whatever happens to the y = 2 x^2 happens 1 unit 'later' on the graph of y = 2 ( x - 1 ) ^ 2. We can see that the y values 18, 8, 2, 0, 2, 8, ... occur one unit further down on the y = 2 ( x - 1 ) ^ 2 table than on the y = 2 x^2 table, indicating this shift.
This can be summarized succintly by the following statement:
The result, as shown below, will be that the graph of y = 2 ( x - 1 ) ^ 2 is shifted one unit to the right of the graph of y = 2 x^2.
The second graph includes the 'intermediate' graph of y = 2 x^2 as well as the original y = x^2 graph and the graph of y = 2 ( x - 1 ) ^ 2.


On the graph of y = x^2 below sketch a graph of y = 2 (x + 1)^2. Make a table at right.
| y | y=x^2 | y = 2 x^2 | y=2 * (x-1)^2 |
| -3 | 9 | 18 | 32 |
| -2 | 4 | 8 | 18 |
| -1 | 1 | 2 | 8 |
| 0 | 0 | 0 | 2 |
| 1 | 1 | 2 | 0 |
| 2 | 4 | 8 | 2 |
| 3 | 9 | 18 | 8 |


On the graph of y = x^2 below sketch a graph of y = 2 (x+1)^2 - 1. Make a table at right.
The table below shows how we start with y = x^2, double y to get y = 2 x^2, shift 1 unit to the left to get y = 2 ( x + 1 ) ^ 2 and then subtract 1 to get the desired function values.
|
y |
y=x^2 |
y = 2 x^2 |
y=2 * (x+1)^2 |
y=2 * (x+1)^2 - 1 |
|
-3 |
9 |
18 |
8 |
7 |
|
-2 |
4 |
8 |
2 |
1 |
|
-1 |
1 |
2 |
0 |
-1 |
|
0 |
0 |
0 |
2 |
1 |
|
1 |
1 |
2 |
8 |
7 |
|
2 |
4 |
8 |
18 |
17 |
|
3 |
9 |
18 |
32 |
31 |
The graphs at the right indicate the first graph y = x^2, the third-step graph of y = 2 ( x + 1 ) ^ 2, and the final graph of y = 2 ( x + 1 ) ^ 2 - 1.


On the graph of y = x^2 below sketch a graph of y = 2 x^2 - 1. Make a table at right.


On the graph of y = x^2 below sketch a graph of y = 2 (x-2)^2 + 3. Make a table at right.
|
y |
y=x^2 |
y = 2 x^2 |
y= 2 (x - 2 ) ^ 2 |
y = 2 ( x - 2) ^ 2 + 3 |
|
-3 |
9 |
18 |
50 |
53 |
|
-2 |
4 |
8 |
32 |
35 |
|
-1 |
1 |
2 |
18 |
21 |
|
0 |
0 |
0 |
8 |
11 |
|
1 |
1 |
2 |
2 |
5 |
|
2 |
4 |
8 |
0 |
3 |
|
3 |
9 |
18 |
8 |
11 |


note full window -15 to 15 and -10 to 10
9. What are the values of y(10) and y(10.3)?
10. It you calculate ( y(10.3) - y(10) ) / ( 10.3 - 10) what do you get, and what is the meaning of this result?
11. On the given graph of depth vs. clock time observations, sketch the t = 0, t = 1, t = 2, t = 3 and t = 4 points of the basic quadratic fuction y = x^2. In what ways does the graph of y = x^2 differ from the graph of y(t) = 0.0062 t^2 - 0.6497 t + 15.21?
Note: The To Be Memorized link now includes Properties of a Quadratic Function, as listed below.
1. Quadratic Functions have the form y(x) = a x^2 + b x + c.
2. The graph of a quadratic function is a parabola.
3. The parabola is symmetric about its vertical axis of symmetry.
4. The vertex is the extreme point of the parabola and lies on the axis of symmetry.
5. The zeros of the function lie at x = (-b +- sqrt(b^2 - 4 a c) ) / (2a).
6. The axis of symmetry of the function is the line x = - b / (2 a), which lies halfway between the zeros as long as the function has real zeros.