Class 040922
To check your test grades:
At the computer:
Using the program h:\shares\physics\mcg run the program. When asked for course number enter the word 'quizzes'.
If you get an endless loop, hit ctrl-alt-del and choose Task Manager, highlight the program and close it, then start it again.
Run the program and do as it says. Type in your VCCS login name, if you know it, and if not just type in your first initial and last name (no punctuation). Then type in quizzes for your course.
The sequence of buttons is Next Question, Display Choices, Enter Answer and See Results, or something very much like that.
On paper:
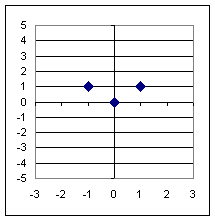
The three points depicted in the figure below are the 'basic points' of the basic quadratic function y = x^2. If each of the three points are shifted 2 units to the right then 1 unit down, sketch the resulting 3 points and the resulting parabola.

The figure below depicts the three basic points of the basic quadratic function.
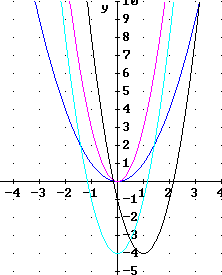
The vertical stretch by factor 3 moves each point 3 times further from the x axis, moving the original points from (-1, 1), (0, 0) and (1, 1) to (-1, 3), (0, 0) and (1, 3). The vertical stretch multiplies all y values by 3 so the function, which was originally y = x^2, becomes y = 3 x^2.
The vertical shift of -2 units changes all y coordinates by -4, moving the three points (-1, 3), (0, 0) and (1, 3) to (-1, -1), (0, -4) and (1, -1). The y values have all been changed by -2 so the function changes from y = 3 x^2 to y = 3 x^2 - 4.
The horizontal shift of -1 unit changes all x coordinates by -1, moving the three points(-1, -1), (0, -4) and (1, -1) to (-2, -1), (-1, -4) and (0, -1). The x values have all been changed by -1 so the function changes from y = 3 x^2 - 4 to y = 3 ( x - (-1) ) ^ 2 - 4, or y = 3 ( x + 1 ) - 4.
You should be able to identify each of these graphs in the figure at right, each of which you should have constructed based on just the behavior of its three basic points.

The figure below depicts the three basic points of the basic quadratic function.

The figure below depicts the three basic points of the basic quadratic function.
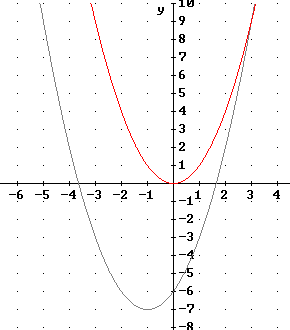
The vertex is at x = - b / (2 a) = -4 / (2 * 1) = -2. At this point y = (-2)^2 + 4 * (-2) - 3 =-7.
The vertex of the y = x^2 parabola is at (0, 0), corresponding the the middle of the three basic points shown below. To move the vertex to (-2, -7) would require a horizontal shift of 2 units and a vertical shift of -7 units.
The three basic points (-1, 1), (0, 0) and (1, 1) would shift to
Since the parabola would not change shape, it parabola would pass through these points, as giving us the parabola shown to the right of the basic points graph.
The function that horizontally shifts the y = x^2 parabola -1 units and vertically shifts it -7 units is y = ( x - (-1) ) ^ 2 - 7 = (x+1)^2 - 7.

The figure below depicts the three basic points of the basic quadratic function.
The basic points become (-1,2), (0,0) and (1, 2).
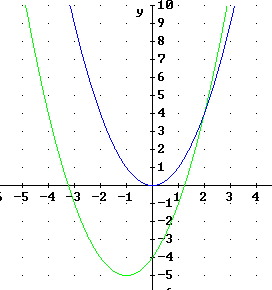
The vertex is at x = - b / ( 2 a) = -4 / (2 * 2) = -1. Substituting into the equation of the function we get y = -5.
So we have to shift the original vertex (0, 0) through -1 unit in the horizontal direction and -5 units in the vertical.
Our basic points therefore move from (-1,2), (0,0) and (1, 2) to (-2, -3), (1, -5) and (0, -3).
Using these points we construct the graph depicted below.
The new function is y = (x - (-1) ) ^ 2 - 5, or y = (x + 1) ^ 2 - 5.

The graph below depicts a function y = f(x). Sketch on the same graph the graphs of
and label each graph accordingly.
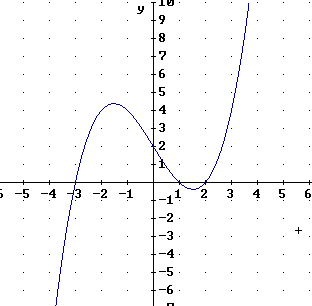
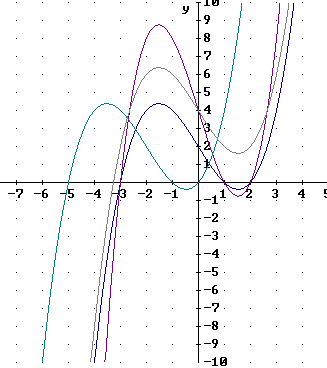
y = 2 f(x) multiplies all y values by 2, vertically stretching the graph by factor 2, i.e., moving all points twice as far from the x axis. Points on the x axis will therefore not be moved ( 2 * 0 = 0, after all), so the graph will pass through the x axis at the same points as the original. The peak and the valley of the graph will end up directly above and below the peak and valley of the original but twice as far from the x axis. You should be able to easily pick this graph out from those shown below.
y = f ( x + 2 ) will have the same y values as the original, but for x values which are 2 less than for the original. This shifts the graph 2 units to the left. The points where the graph intersects the x axis, and the peak and the valley, will all move 2 units to the left, as will all other points. You should be able to easily pick this graph out from those shown below.
y = f(x) + 2 adds 2 to all the y values of the original. The points where the graph intersects the x axis, and the peak and the valley, will all move 2 units to up, as will all other points. You should be able to easily pick this graph out from those shown below.
