1122
Bare-bones Nutshell Summary
Overall Scheme of the Course
You should know the following very well:
The functions studied in Precalculus I consist of
The basic linear, quadratic, power and exponential functions are y = x, y = x^2, y = x^p and y = 2^x. Each function has basic points/asymptotes which can be used as a guide to graphing:
A vertical stretch of a graph by factor A moves every point A times as far from the horizontal axis. Points which are further from the horizontal axis move more than points which are close, and points which are on the horizontal axis do not move at all.
A horizontal or vertical shift of a graph moves every point through the same displacement in that direction.
Given a basic function f(x), the graph of A f(x-h) + k is vertically stretched from the graph of f(x) by factor A, horizontally shifted h units and vertically shifted k units. By keeping track of the effects of these transformations on the basic points it is possible to construct an approximate graph of the transformed function.
Given three points on the graph of a quadratic function we can obtain and solve a system of 3 equations in 3 unknowns for the parameters a, b and c of the y = f(x) = a x^2 + b x + c form of the function.
Given two points on the graph of a linear function we can obtain and solve a system of 2 equations in 2 unknowns for the parameters m and b of the y = f(x) = m x + b form of the function.
In general given a function model with n parameters we can, given n points on the graph, find n simultaneous equations for those parameters. The equations for the two-parameter models y = A x^p and y = A b^x can each be solved using the laws of exponents.
Reading graphs, rate of change
To find the y coordinate of the function y = f(x) which corresponds to a given x coordinate x = x1, replace x by x1 to get y1 = f(x1). If we know the formula for f(x) we can then easily calculate the y value. On a graph this corresponds to finding the vertical coordinate where the graph intersects the vertical line x = x1.
To find the x coordinate(s) of the function y = f(x) which correspond(s) to a given y coordinate y = y1, replace y by y1 to get the equation y1 = f(x) and solve this equation for x. On a graph this corresponds to finding the horizontal coordinate where the graph intersects the horizontal line y = y1.
The rate of change of y with respect to x is (change in y) / (change in x), often written `dy / `dx, where `d stands for the capital Greek Delta.
Between two points on a graph of y vs. x the rise `dy represents the change in y, the run `dx represents the change in x, and the average slope between these points is rise / run = `dy / `dx.
To interpret a graph we first ask what the y coordinate means, what the x coordinate means, what the rise between two point means, what the run between two points means, and what the slope between the two points therefore means.
The average rate of change of y with respect to x between coordinates x and x + `dx is ( f(x+`dx) - f(x) ) / `dx. Given the function f(x) we can substitute into this form, simplify and consider what happens as `dx shrinks to zero. By this process we can obtain a formula that gives us the instantaneous rate of change of y with respect to x for this function.
Proportionality and power functions
Anything made up of little cubes obeys a proportionality of the form y = k x^3.
Anything made up of little squares obeys a proportionality of the form y = k x^2.
A proportionality equation y = k x^p for given p can, given a value of y corresponding to a given value of x, be solved for k to obtain a power-function model which can then be used to predict y given a value of x, or a value of x given y.
Exponential and logarithmic functions
An exponential function y = A b^x has growth factor b and growth rate b - 1.
The exponential function y = A b^x is idential to the function y = A * 2^(k x), where 2^k = b.
e is the limit as n -> infinity of the expression (1 + 1/n) ^ n.
The exponential function y = A b^x has the following properties
The base b logarithm is the function which is inverse to y = b^x.
The base e logarithm is the 'natural log'. The base e log of x is written ln(x).
The laws of logarithms are inverse to the laws of exponents.
Exponential equations can often be solved by taking the log of both sides of the equation.
For a given set of y vs. x data, if log(y) vs. log(x) is linear then y is a power function of x, if log(y) vs. x is linear then y is an exponential function of x, and if y vs. log(x) is linear then y is a logarithmic function of x.
Polynomial functions
A polynomial function can always be factored into a constant factor, linear factors of the form x - z and irreducible quadratic factors of the form a x^2 + b x + c with a negative discriminant b^2 - 4 a c.
A polynomial function has the following properties:
Combining Functions
When combining graphs of two functions f and g we start by asking the following:
The sum of f(x) and g(x) has a graph which has the following characteristics
The product of f(x) and g(x) has the following characteristics:
The composite function f(g(x)) is obtained by substituting g(x) for z in the expression f(z). The composite function g(f(x)) is obtained by substituting f(x) for z in the expression g(z).
***************************************************************************************
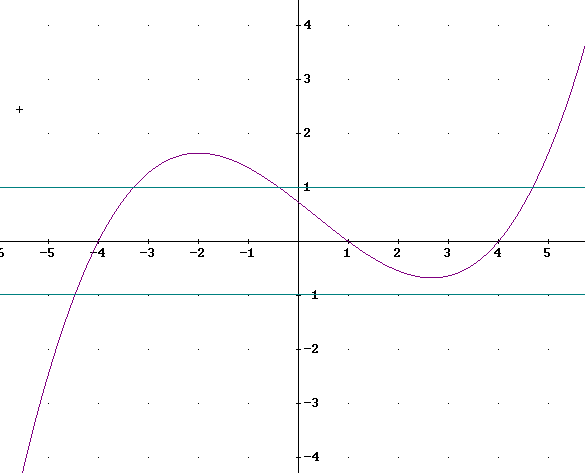
We now consider the process of combining graphs: The first question regards the graph depicted below.

Answer the following for the graph depicted above:
f(x) = 0 at x = -4, 1 and 4.
| f(x) | = | y |, so | f(x) | = 1 whenever | y | = 1, which occurs whenever y = 1 or y = -1.
It looks like | f(x) | = 1 a little to the left of x = 4, a little to the right of x = 4, a little to the left of x = 0 and a little to the right of x = 4. Estimate these values roughly as x = -4.5, -3.5, -.5 and 5.
f(x) > 0 on the intervals (-4, 1) and (4, infinity).
f(x) < 0 on the intervals (-infinity, -4) and (1, 4)
| f(x) | < 1 whenever the graph lies between the lines y = -1 and y = 1.
Assume that our estimates of the points where | f(x) | = 1, which were x = -4.5, -3.5, -.5 and 5, are accurate. Then:
| f(x) | < 1 on the interval (-.5, 5).
On what intervals is f(x) increasing and on what intervals is f(x) decreasing?
A relative maximum point is a point where the graph is higher than at any neighboring points. It's the 'top of the hill'.
A relative minimum point is lower than any neighboring points.
f(x) is increasing up to the first relative maximum point, which occurs at about x = -1.8. Using this estimate f(x) is increasing on the interval (-infinity, -1.8).
f(x) is then decreasing up to its first relative minimum point at about x = 2.8. So f(x) is decreasing on (-1.8, 2.8).
Then f(x) is increasing on (2.8, infinity).
Note that if we have two graphs f(x) and g(x) we want to combine, we then ask the same questions of g(x).
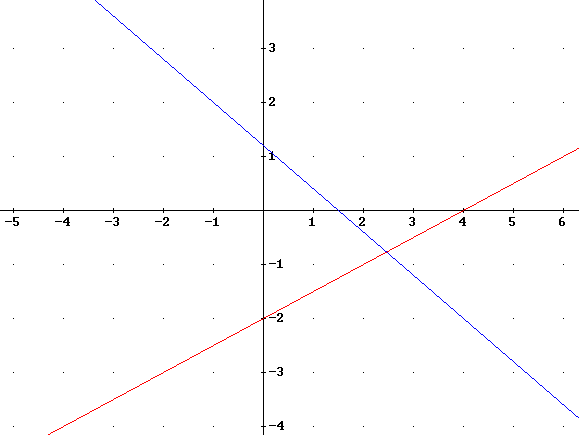
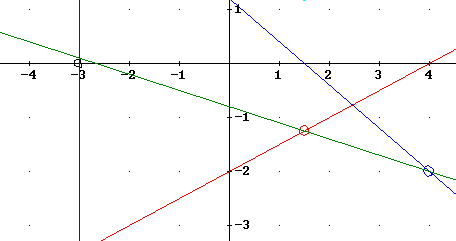
Identify the same information for the f(x) and g(x) graphs shown above. Let f(x) be the increasing graph, represented by the red line, and g(x) the decreasing line represented by the blue graph.
The sum of f(x) and g(x) has a graph which has the following characteristics
For the indicated graphs f(x) > 0 on (4, infinity) so the sum graph lies higher than the g(x) graph on (4, infinty)
g(x) > 0 on (-infinity, 1.5), so the sum graph lies higher than the f(x) graph on (-infinity, 1.5).
g(x) = 0 when x = 1.5. So the graph of the sum intersects the graph of f(x) when x = 1.5. We mark the x = 1.5 point of the f(x) graph as a point on the graph of f + g.
Similarly f(x) = 0 when x = 4, so the f + g graph will coincide with the g graph at x = 4. We mark this point.
The two points marked here are indicated by small circles on the graphs of f(x) and g(x) below.
A vertical line is shown at x = -3; this vertical line is seen to intersect g(x) above the x axis and f(x) below, at approximately equal distances from the x axis. For the given function f(x) and g(x) therefore lie at approximately equal distance on opposite sides of the x axis when x = -3, approx. At this point f + g will be zero and we mark the point (-3, 0) as a point on the sum graph, using a small circle at this point.
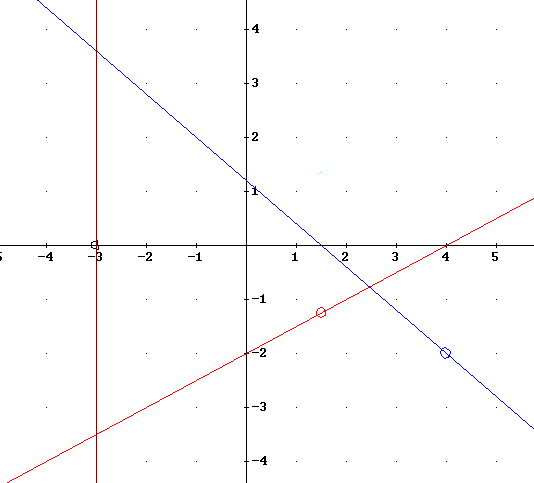
The three marked points lie on a straight line. This is consistent with the fact that both functions are straight lines, so that f(x) = m1 x + b1 and g(x) = m2 x + b2 with the result that f(x) + g(x) = (m1 + m2) x + (b1 + b2).
The graph depicted below shows the actual straight line obtained by adding the two functions on the graph. We see that this line goes through the points indicated on the f(x) and g(x) graphs, and very near our estimated point at (-3, 0).
The product of f(x) and g(x) has the following characteristics:
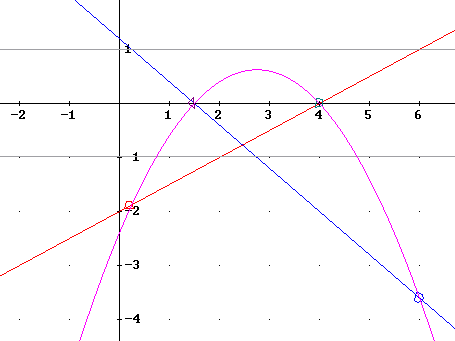
f(x) = 0 at x = 4 so that the product graph will take value 0 at x = 4. The point (4, 0) is marked on the graph below.
g(x) = 0 at x = 1.5, so that the product graph will take value 0 at x = 1.5. The point (1.5, 0) is marked on the graph below.
f(x) and g(x) have opposite signs on the interval (-infinity, 1.5), on which interval f(x) > 0 and g(x) < 0.
f(x) and g(x) have the same signs on the interval (1.5, 4), on which interval f(x) < 0 and g(x) < 0.
f(x) and g(x) have opposite signs on the interval (4, infinity), on which interval f(x) > 0 and g(x) < 0.
So the product graph will lie above the x axis on the interval (1.5, 4), and below the x axis elsewhere.
g(x) = 1 at approximately x = .2. The value of f(x) * g(x) will therefore be the same as the value of f(x) when x = .2, and the point x = .2 point of the f function, at (.2, f(.2) ), lies on the product graph. This point is marked.
Similarly f(x) = 1 at approximately x = 6. The value of f(x) * g(x) will therefore be the same as the value of g(x) when x = 6, and the point x = 6 point of the g function, at (6, g(6) ), lies on the product graph. This point is marked.
Putting together the characteristics and the points we have observed so far we conjecture that a parabola might fit the given points.
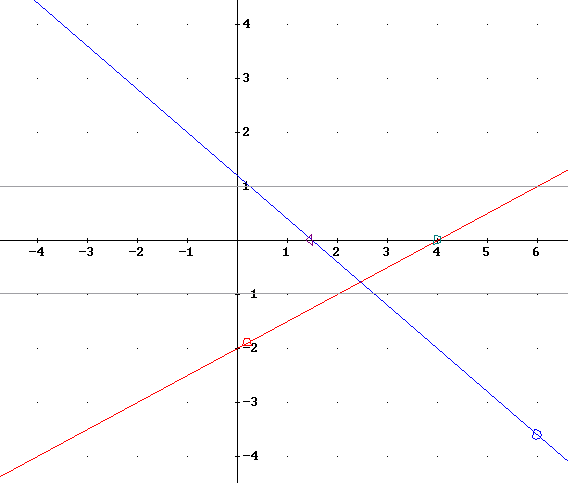
The graph of the product function is depicted below. The product function, being the product of two linear functions, is clearly a degree-2 polynomial, which is a quadratic function.
