"
Class Notes Precalculus I, 9/24/98
Linear Functions
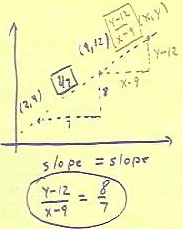
Today's quiz problem was to find the slope = slope equation of a straight line through
the points (2,4) and (9,12), using and interpreting a sketch showing the geometry of the
situation.
- We follow the usual procedure, sketching the two points in the slope triangle between
them.
- We obtain slope 8/7.
- We then place a point (x,y) on the line and sketch the slope triangle between (9,12) and
(x, y).
- The slope of this triangle is (y - 12)/(x - 9).
- If the point (x, y) lies on the line, then the two slopes must be equal and we have the
slope = slope equation
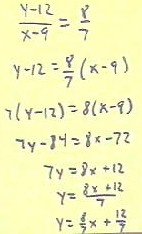
We next solve this equation for y.
- We begin by multiplying both sides
by (x-9), obtaining the second step below.
- We then multiply both sides by 7,
obtaining the third step below.
- In the fourth step we apply the
distributive law.
- In the fifth step we add 84 to
both sides, in the sixth step we multiply both sides by 1/7, and in the final step we use
the distributive law to obtain the slope-intercept form of the line.
Video Clip #01
http://youtu.be/CvCxbR8qQNM
The assignments due for next time are long in that they have a lot of pages. However,
there isn't a whole lot of new material, and many of the problems are fairly easy. A few
new ideas do occur, and these are summarized below.
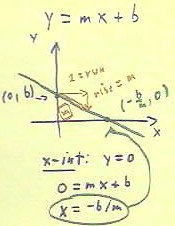
The x intercept of the line given by y = mx + b is easily found by noting that
the x intercept occurs when y = 0.
- In this case the equation becomes 0 = mx + b, which is easily solved to obtain x = - b /
m. The x intercept (-b/m, 0) is labeled on the graph below.
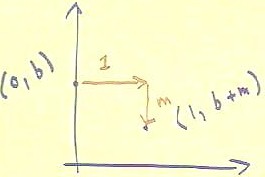
The graph of a straight line can be determined by its two basic points, which
are here taken to be the y intercept and the point 1 unit to the right of the y intercept.
- This latter point is
located by moving to the right 1 unit, which corresponds to a run of 1, then moving up m
units.
- We see that the slope of the
resulting triangle is m.
- Observe also that in the figure
below when we move up m units we actually end up moving down.
- This is because in the figure, the
slope m is implicitly negative; moving up by a negative amount is the same is moving down.
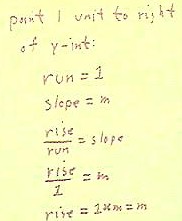
The figure below shows how we might calculate the location of the point 1 unit to the
right of the y-intercept.
- Noting that the run is 1 and the
slope is m, we write rise / run = m and substitute 1 for run.
- We obtain rise / 1 = m, which we
easily solve to see that rise = m.
- So again we see that the point is
found by moving through a run of 1 and a rise of m.
The coordinates of the point 1 unit to the right of (0,b), on the graph of y = m x + b,
are therefore seen to be (1, b + m).
Video Clip #02
http://youtu.be/90et03civpw
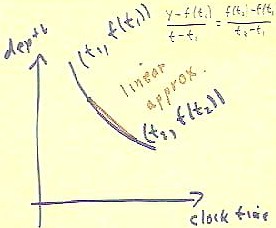
We can use a linear function to approximate any function over a short distance.
- For example if we have a depth vs.
clock time function, the straight line between two points (t1, f(t1)) and (t2, f(t2)) on
the graph of the function stays pretty close to the graph, as long as the points aren't
too far apart.
- This linear approximation is
indicated by the red line segment in the figure below.
- Using the slope = slope form of
the straight line between the two points, we see that the equation of the line is (y -
f(t1)) / (t - t1) = (f(t2) - f(t1)) / (t2 - t1).
Video Clip #03
http://youtu.be/M1HehtceDQ0
The idea of a rate equation is extremely important in calculus.
- This idea is simple enough that it is worth a first encounter here. (We won't learn how
to solve rate equations in this course -- that takes until well into the second semester
of a good calculus course).
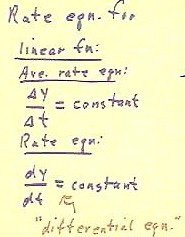
It should be obvious by now that for linear function y(t), the average rate between two
points, which is `dy / `dt for those points, and which is represented by the slope of the
graph between the points, must always be the same.
- This average rate equation expresses the obvious -- that the rate of change of a linear
function is constant.
The rate equation is expressed as dy / dt = constant, where we are using dy and dt
instead of `dy ('delta' y) and `dt ('delta' t) to express that this is not an average rate
but an instantaneous rate -- the precise rate at any given instant as opposed to an
average over an interval.
- The distinction between average
rate and instantaneous rate will be made clear in a calculus class, but it is well worth
thinking about in advance.
- Also for future reference, an
equation involving instantaneous rates like dy / dt is called a 'differential equation'.
Video Clip #04
http://youtu.be/XVWq1ISS_KI
The idea of a difference equation is very useful in characterizing
different functions. Also, difference equations are important in their own
right--when we can't solve a differential equation we often use a difference equation to
find an approximate solution.
We can begin to understand difference equations through the following exercise, which
you should do in your head:
- Pick a number between 15 and 25, then pick a number between 3 and 7. Now follow this
rule:
- Your next number is always equal to your present number plus the second number you
picked.
- At the beginning your present number is the first number you picked.
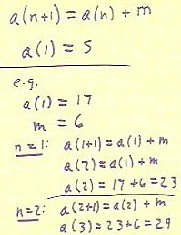
The equation a(n+1) = a(n) + m, with a(1) = s, can be made to correspond to the process
you just followed.
- For example if your first number was 17 and your second number was 6, we would have
obtained 17, 23, 29, 35, ....
- If we let m = 6 and a(1) = 17, the equation gives us the following information:
- For n = 1, the equation will read a(1+1) = a(1) + m. Since 1+1 = 2, a(1) = 17 and m = 6,
the equation becomes a(2) = 17 + 6, so a(2) = 23.
- For n = 2 the equation reads a(2+1) = a(2) + m; since 2 + 1 = 3, a(2) = 23 and m = 6,
the equation becomes a(3) = 23 + 6 = 29.
- For n = 3, etc., etc.
- It should be clear that the process defined above will generate the numbers 23, 29, 35,
....
The equation a(n + 1) = a(n) + m is called a 'difference equation', and the 'starting'
condition a(1) = 17 is called an initial condition.
- Thus we see that if we have a
difference equation with an initial condition, we can use the equation and the condition
to generate a sequence of numbers.
If we plot the numbers a(n) we
get from this difference equation vs. n, we see that the points lie on a straight line.
- For any linear function y = mx +
b, if can let a(0) = b the difference equation a(n+1) = a(n) + m will give us a sequence
of values a(0), a(1), a(2), ..., which when plotted as described give us points on the
graph of y = mx + b.
http://youtu.be/DNmw431a6sI
Video Clip #05
"
