"
Class Notes Precalculus I, 11/13/98
Graphs of Polynomials
The quiz problem was to graph the function (x - 3) (x2 - 5x + 6)(x2
+ 2x + 20).
- We begin by attempting to completely factor the expression defining the function.
- The first quadratic clearly factors into (x - 3)(x - 2).
- The second quadratic has no zeros (when we set the expression equal to 0 and use the
quadratic formula we get -76 under the radical) and therefore cannot be factored.
- We can see that factorization is in this case impossible because if the expression did
factor there would be corresponding zeros, which would contradict the results of the
quadratic formula.
- The completely factored form of the quadratic is the expression in the second line of
the figure below.
- In the third line we note that we have three linear and one irreducible quadratic
factors.
From the factors we see that the zeros of this function are 3, 3, and 6.
- The y intercept is easily found to
be 360 by substituting 0 for x.
- The far left behavior is negative,
since a very large negative number would give us three negative factors, corresponding to
the three linear factors, and one positive factor corresponding to the irreducible
quadratic (the x2 term dominates this expression when the magnitude of x is
large).
- For large positive values of x,
the expression will give us a very large positive result, so the far right behavior is
positive.
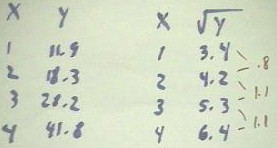
In the figure below we examine the relationship between the solutions of a quadratic
equation and the factors of a quadratic polynomial.
- We know that x2 - 5x -
6 factors as (x - 6) (x + 1), and that this implies zeros at x = -1 and at x = 6.
- If we set the expression equal to
zero and use the quadratic formula, we obtain zeros 6 and -1, in agreement with the zeros
we got when we factored the expression.
- Had we not known the factors of
the expression, the results of the quadratic formula would have told us that the factors
must be (x - 6) (x + 1).
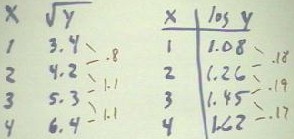
If we apply the same reasoning to the expression x2 - 5x - 7, which we
cannot easily factor, we would obtain zeros at x = 2.5 + `sqrt(53) / 2 and x = 2.5 -
`sqrt(53) / 2 .
- Our conclusion would therefore be
that x2 - 5x - 7 = (x - (2.5 + `sqrt(53) / 2) ) (x - (2.5 - `sqrt(53) / 2) ).
Returning to the task of graphing the function, we see that the zeros are at x = -1, 3,
6, the y intercept is at y = 360, and that the far-left and far-right behaviors are
negative and positive, respectively.
- Having indicated these
characteristics on a graph, it becomes easy to sketch an approximate graph of the
polynomial.
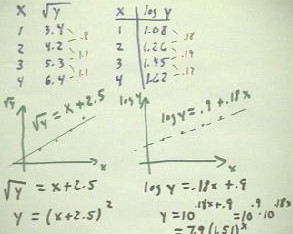
Video file #01
http://youtu.be/TbETIytBYZ0
We now change the function slightly, as indicated below.
- The factorization of the function in this case becomes (x - 3)2 (x - 2)(x2
+ 2x + 20).
- We note that (x - 3) now appears twice in the factorization. We ask what effect this
might have on the shape of the graph near x = 3.
-
- If x is close to 3, then the factors (x - 2) (x2 + 2 x + 20) will give us a
value near 35.
- In that case the polynomial will be approximately equal to (x - 3)2 [35] = 35
(x - 3) 2.
- A graph of this expression is just a parabola with vertex at x = 3 (beginning with the
function y = x2, we vertically stretch by factor 35 then shift three units to
the right).
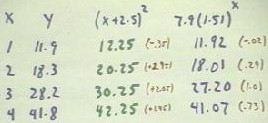
- It follows that if we graph the
function y = 35 (x - 3)2 and the function (x - 3)2 (x -2) (x2
+ 2 x + 20) near x = 3, the graphs will be close to one another, becoming closer and
closer as x gets closer and closer to 3.
- The figure below depicts such a
graph.
Using DERIVE, we authored both of
these functions and plot them near x = 3.
- The graph we obtained is very
similar to the one sketched here, except that instead of being shifted slightly to the
right of the 'red' parabola the blue graph would be shifted slightly to the left.
- You should check this out using
DERIVE.
Video file #02
http://youtu.be/0mTqhhKcwgs
Video file #03
http://youtu.be/96oCE4YBiPQ
The graph of the function is thus constructed by
- locating the zeros and the y intercept,
- noting the far-left and far-right behaviors, and recalling that
- because the zero at x = 3 is the result of not one but two factors (x -3) the graph
should therefore act like that of a quadratic function near x = 3, we obtain the graph
below.
A DERIVE plot confirms this overall shape for the graph. However, on a scale where the
y intercept is visible the 'hump' between x = 2 and x = 3 does not rise nearly as high as
it does on the graph shown below.
- You should confirm this using
DERIVE.
We can extend the insights we have gained here to the function y = (x + 5)3
(x - 2) 2 (x + 2).
- We see that the zeros are at x = -5, x = -2, and at x = 2.
- The zero at x = 2 will be quadratic in nature while that at x = -2 will be linear in
nature.
- The zero at x = -5 will act like a cubic function c * (x + 5)3, where c
stands for the value of the product of the remaining factors at x = -5.
The graph shown below depicts all these behaviors, as well as the y intercept y = 1,000
and the fact that the far-left and far-right behaviors are both positive.
Video file #04
http://youtu.be/-oykSMMGAwg
"
