"
Class Notes Precalculus I, 11/17/98
Graphs of Polynomials and Power Functions
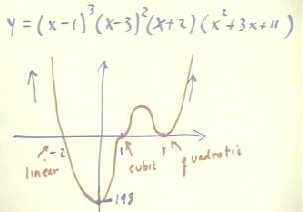
The quiz problem for today was to graph the polynomial in the figure below.
- Recall that the behavior of a polynomial near one of its zeros is the same as that of a
power function whose power equals the multiplicity of the zero.
- For example, (x - 1)3 results in a zero at x = 1.
- Near x = 1 the remaining factors of the polynomial are very nearly constant, so that in
the vicinity of x = 1 the function is nearly approximated by y = constant * (x-1)3.
- This function is a vertical stretch of the function y = x3 by the (constant)
factor, and a vertical shift to the right of 1 unit.
- We could evaluate (x-3)2 (x+2) (x2 + 3x + 11) at x = 1 to
determine the actual value of the constant and hence the extent of the vertical shift. But
the main point is that the graph will pass through the zero at x = 1 in the same way as
the y = x3 function passes through x = 0, coming in steeply from below,
leveling off at x = 0, then again becoming steeper.
- This is the behavior of the graph as depicted in the figure below at the x = 1 point.
- By similar considerations, we see that the graph must be constant * (x - 3)2
in the vicinity of x = 3, and so must be parabolic near that point. This is shown in the
figure below.
- The constant in this case could, if we wished, be obtained by evaluating the product of
the remaining factors and x = 3.
- The factor (x + 2) is linear, and the function in the vicinity of x = -2 will be y =
constant * (x + 2), where the constant for this function will be the product of the
remaining factors of the polynomial evaluated at x = -2.
- The graph of the polynomial passes
through x = -2 in a linear manner, as depicted below.
- Note that the quadratic factor has
no zeros, as the quadratic formula will reveal if we set this factor equal to zero (we
will get a negative under the radical).
Video File #02
http://youtu.be/KaHrPmC0aXc
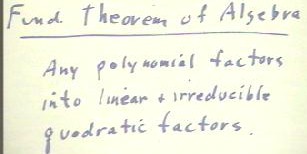
We have mentioned the Fundamental Theorem of Algebra. This Theorem is stated in the
figure below.
- The Fundamental Theorem of Algebra
tells us that if we have any polynomial function we can factor it into linear and
irreducible quadratic factors, and that these factors will in the end be the same no
matter how we go about the factoring.
The degree of the polynomial is related in a simple way to the degrees of its factors.
- It is easy to see that each
irreducible quadratic factor contributes 2 to the degree of the polynomial, since when we
multiply by a quadratic factor we increase the power of the highest-powered term by 2.
- Similarly each linear factor
contributes 1 to the degree of the polynomial.
It follows that the degree of the polynomial must be equal to the sum of the
number of linear factors and double the number of irreducible quadratic factors:
- degree = # lin. factors + 2 * # of irred. quad. factors.
Looking at it another way, we see that the number of linear factors is equal to the
degree of the polynomial minus double the number of irreducible quadratic factors:
- # of lin. factors = degree - 2 * #
of quad. factors.

For example, a polynomial of degree 12 can be made up of linear and quadratic factors
in many ways:
- A degree-12 polynomial might have 12 linear factors.
- A degree-12 polynomial might also have exactly 1 irreducible quadratic factor, which
leaves room for 10 linear factors.
- Or it could have 2 irreducible quadratic factors, leaving 8 linear factors.
- Or we could have 3 irreducible quadratic factors and 6 linear factors; or
- 4 irreducible quadratic factors and 4 linear factors; or
- 5 quadratic factors and 2 linear factors; or
- 6 quadratic factors and 0 linear factors.
The number of zeros could thus be 12, 10, 8, 6, 4, 2 or 0.
- We note that as a result the number of turning points for the function could be at most
11, which would for example be the case if the function had 12 distinct zeros (between
each pair of distinct zeros there must be a turning point).
The total number of zeros will include the multiplicity of each zero.
- For example if we had 12 zeros, we
might possibly have, say, 2 zeros of multiplicity 3 (for each of which the polynomial
passes through as a cubic function), 1 zero of multiplicity 2 (with the polynomial
touching the axis as a quadratic), and four linear zeros.
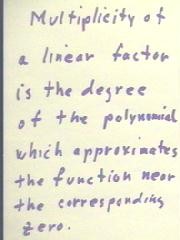
In the figure below we state what was said earlier and alluded to in the preceding
paragraph, that the multiplicity of a linear factor is the degree of the polynomial which
approximates the function in the vicinity of the corresponding zero.
Video File #03
http://youtu.be/nC3RfszYYaQ
Graphs of Power Functions
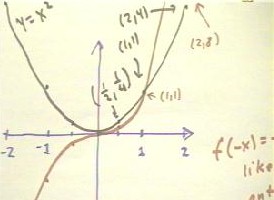
To review the shapes of the graphs of power functions, we first note that the graphs of
y = x2 and y = x3 are as depicted below.
- The key points in graphing a power function are the points where x = 0, 1/2, 1 and 2.
- At x = 0 and at x = 1, the value of any power function y = xp for positive p
will pass through (0,0) and through (1,1).
- So the graphs of both y = x2 and y = x3 pass through (0,0) and
(1,1), as can be seen on the graph below.
- At x = 1/2, we have x2 = 1/4 and x3 = 1/8.
- We see that as the power of x gets
higher and higher, the value of xp at x = 1/2 will get smaller and smaller,
causing the graph between x = 0 and x = 1/2 to become increasingly flat.
- At x = 2, we have x2 = 4 and x3 = 8.
- We see that at x = 2, higher
powers of x will give us greater and greater y values and the graph between x = 1 and x =
2 will get steeper and steeper.
Even and odd powers have different types of symmetry:
- For x = -1/2, -1 and -2, y = x2
gives us the same values as for x = 1/2, 1 and 2, showing us how the graph must be
symmetric with respect to the y axis.
- In contrast, y = x3
gives us negative values for negative x, resulting in a graph that is antisymmetric with
respect to the y axis.
Thus we see that similar patterns
will hold for higher powers of x, with even-numbered powers resulting in graphs which are
symmetric with respect to the y axis and odd-numbered powers resulting in graphs that are
antisymmetric with respect to the y axis.
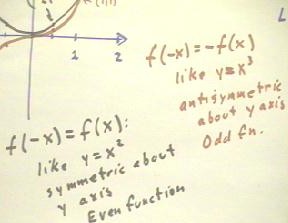
In function notation a condition for a function f(x) to be symmetric about the y axis
is f(-x) = f(x).
- We have just seen that this will
be true for the function y = f(x) = x2, since (-x)2 = x2.
- Such a function is called an even
function.
The corresponding condition for a function antisymmetric with respect to the y axis is
f(-x) = -f(x).
- For example, (-x)3 = -
(x3).
- Such a function is called an odd
function.
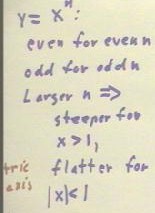
Summarizing the behavior of the functions y = xn, we see that for even
numbers n, the function is even and for odd numbers n the function is odd.
- Larger values of n make a graph
steeper for values of x which are > 1, and flatter for x near 0.
The DERIVE expression vector(xn,n,1,10,1) can be Simplified to obtain the
expression [x1, x2, x3, x4, . . . , x10].
- When graphed this expression will
plot the graphs of all these functions.
- You should do this, and then
observe how the behaviors described here are exhibit by these graphs.
Video File #04
http://youtu.be/5RC0k4MB81s
"
