Test Version 25
Show all work and document your analysis.
You will be given a grade for problems 1-8. Each additional problem will be counted if and only if it increases your score.
1. What is the average rate of change of the principle function $5000 (1.07) t between t = 4 and t = 5?
2. Using DERIVE, find the best fit to the following data, using first a linear fit, then a quadratic fit, then a cubic fit, then a fourth-degree polynomial fit: [ [3, 1], [5, 1.8], [7, 4.3], [9, 7.6], [11, 16.4] ]. Give an argument for and against each fit as opposed to the others, then decide which fit is most likely to tell you how the data is really behaving.
3. The population of a country is 5 million in 1992 and 5.3 million in 1995. What exponential function models the population, in terms of the time t in years since 1992? How long will it take the population to double?
4. Graph the basic points for the exponential function y = 4 * 2 ^ (-.3 t), then sketch the rest of the graph based on these points. Then graph y = 4 * 2 ^ (-.3 t) + 2.
5. Sketch a graph of y = (x - 1) ^ 2 (x - 4) ^ 3 (x2 + 5x - 6).
6. Which of the following sequences s1 or s2 is exponential in nature? s1 = { 3, 4.5, 6.75, 10.125} s2 = {4, 5.125, 7.375, 10.500 }.
7. Solve the equation 2 ^ (3x - 4) = 7 for x.
8. Explain why the graph of y = (x - 2) ^ 2 (x + 4) (x2 + 5x + 8) behaves like a power function near x = 2. What specific power function does it behave like? Sketch a good graph showing the function in the near vicinity of x = 2.
9. Determine whether the following temperature vs. clock time data are best modeled by an exponential or a y = x2 power function: Data points are (t, T) = (3, 3.8); (6, 16.2); (9, 34.7); (12, 65.1).
10. Make a table for y = 5 x2, for x = 0, 3, 6 and 9. Then by transforming x or y (or both), using appropriate transformations, linearize the data set. Show that your linearization will really make a linear graph..
11. Make a table for y = x^4 and use it to obtain a table for its inverse function. Sketch graphs of both functions and show how the graphs are related. What is the formula for the inverse function? Are there any numbers that the inverse function cannot act on?
12. What system of simultaneous equations would you get if you fit to the data set { (2,3), (5,8), (7,6), (10,12) } the polynomial of the lowest possible degree which would pass through all the points?
Notes on the problems rated most difficult by students attending class:
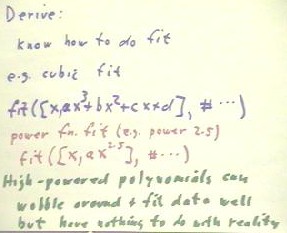
Prob. #2: Author fit function for each type of fit (use mx+b for linear, ax2 + bx + c for quadratic, etc; cubic fit shown below).
Problem #6: An exponential sequence has either constant ratios or constant ratio of diference sequence.
We can conclude that the first sequence has growth factor 1.5 so is modeled by y = A ( 1.5 t).
For sequences, a constant nonzero difference sequence tells you what degree polynomial can be used to generate the sequence.
Prob. 10. We make the specified table for y vs. x.
Since the original function was a power function, we could have used a log y and log x transformation.
Prob. 12: Recall that a linear function fits two points exactly, a quadratic fits 3, a cubic fits 4, etc.. Since we have 4 data points we will use the cubic form y = a x3 + b x2 + cx + d.
Substituting the data points into the cubic form we get the equations below.
Prob. #8: At the x = 2 zero, we find that (x+4)(x2 + 5x + 8) is 132.
The graph of the polynomial near x = 2 will therefore be close to that of the parabola y = 132 (x-2)2, as indicated below.
Near the x = -4 zero, the function will be linear, since everything other than x-4 has a relatively insignificant change while x-4 goes from negative to positive.
"