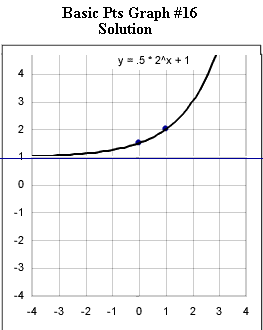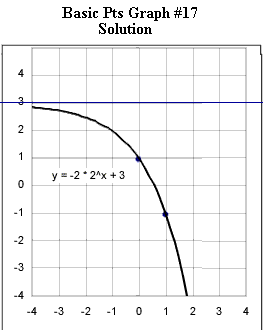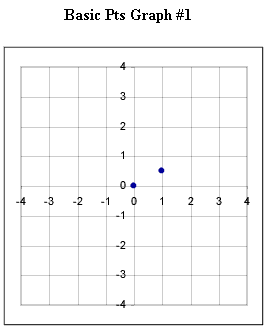
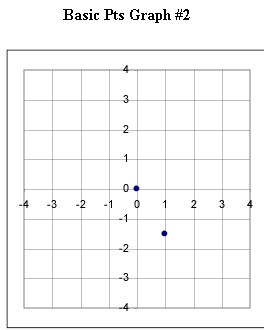
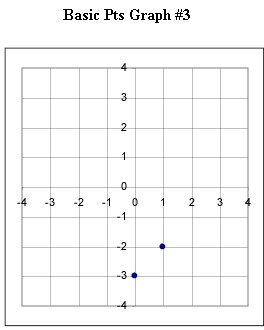
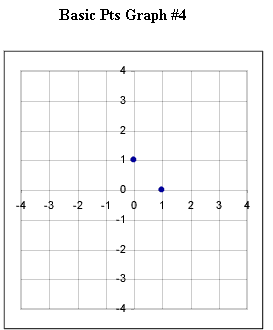
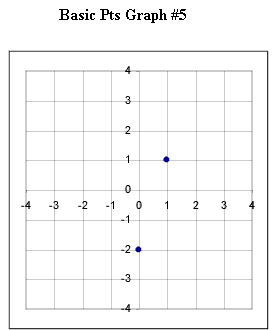
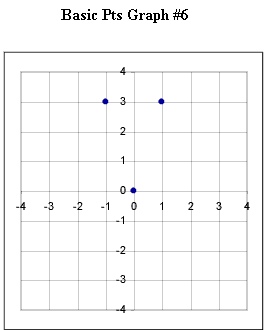
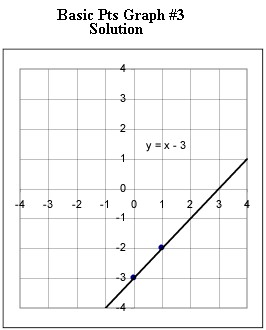
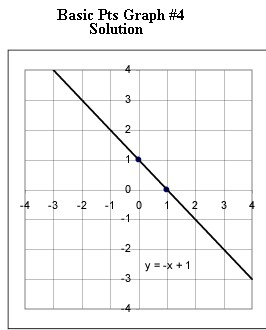
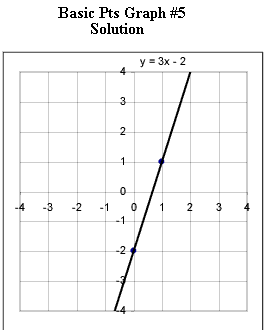
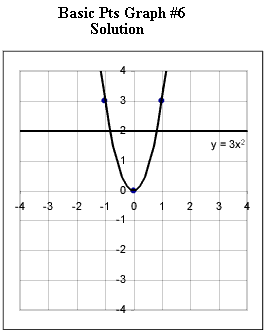
The 17 graphs shown below each depict the basic points for a linear, quadratic or exponential function. Graphs 1-5 are linear; 6-12 are quadratic and 13-17 are exponential.
You should be able to instantly sketch, with reasonable accuracy, the graph of a function if you are given its basic points and the function type (i.e., linear, quadratic, exponential).
Practice until you can do this. You might have to refer to the solutions the first time through. You know what you need to know for now if you can draw the graphs without reference to the solutions. You don't have to be 100% accurate but your graph should be of the right general shape and should be recognizably close to the solution graph.
We will refine our understanding of these functions throughout the course.
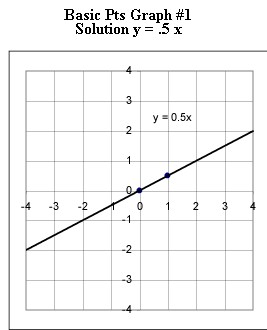
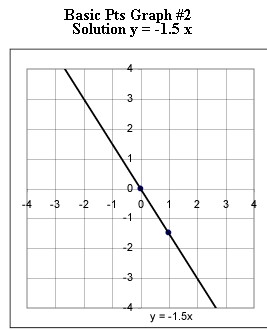
Graphs #1 - # 5 each represent the two basic points for a linear function. Sketch the graph of the linear function corresponding to each set of basic points.


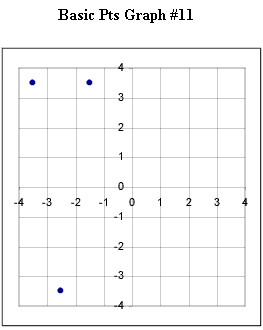
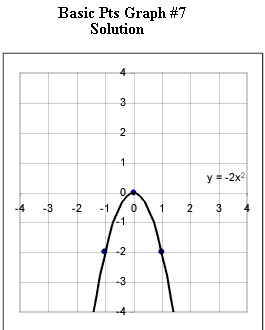
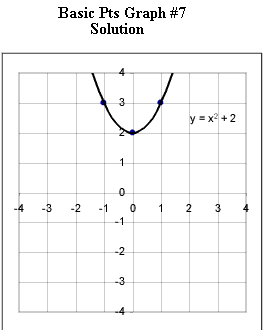
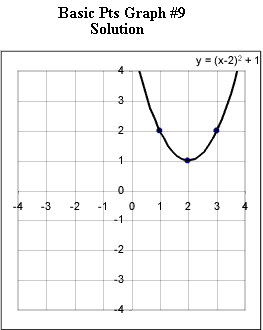
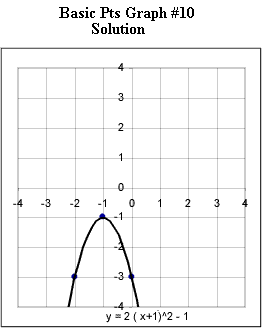
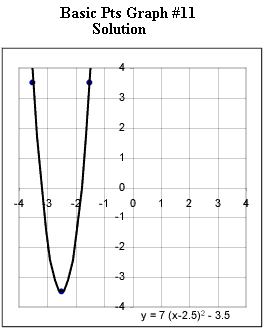
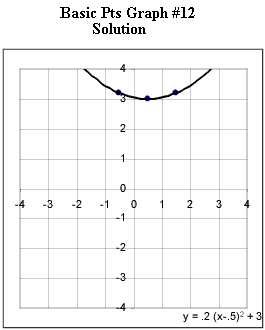
Graphs #6 - # 12 each represent the two basic points for a quadratic function. Sketch the graph of the quadratic function corresponding to each set of basic points.
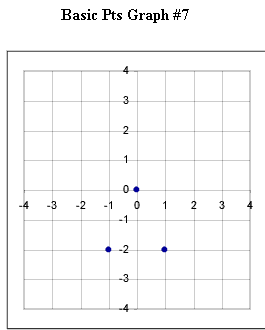
Note: The graph below should be labeled #8.
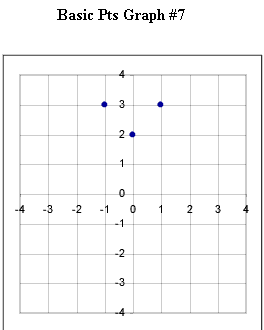
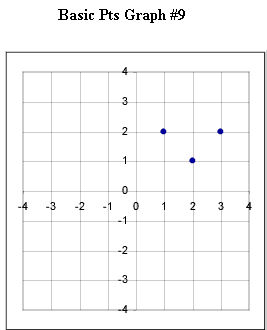
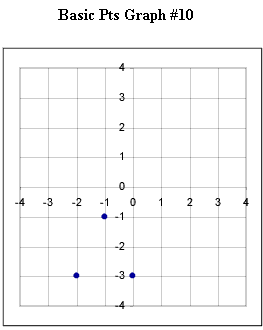

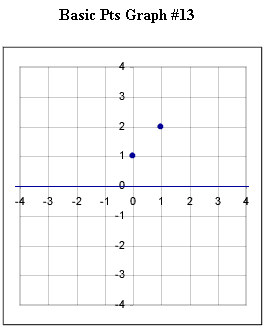
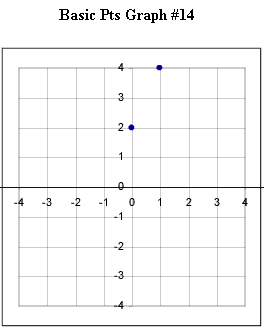
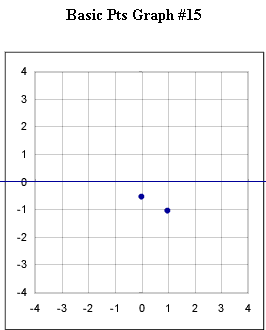
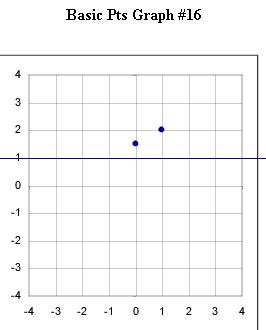
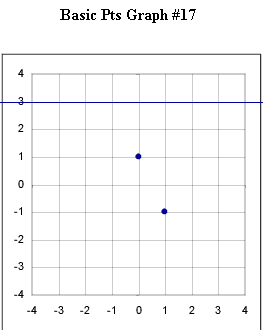
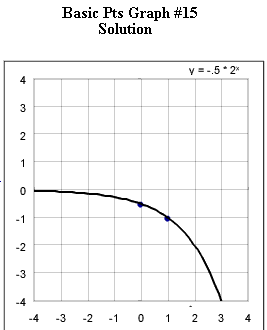
Graphs #13 - # 17 each represent the two basic points for a exponential function with the horizontal asymptotes indicated in the original figure. Sketch the graph of the exponential function corresponding to each set of basic points.
The horizontal asymptote for graph #13 is the x axis.
The horizontal asymptote for graph #14 is the x axis.
The horizontal asymptote for graph #15 is the x axis.
The horizontal asymptote for graph #16 is the line y = 1.
The horizontal asymptote for graph #17 is the line y = 3.
Note: The second graph below should be labeled #8.
Horizontal asymptote is the x axis for both graphs below
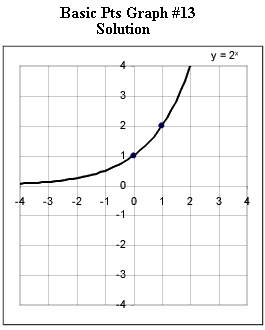
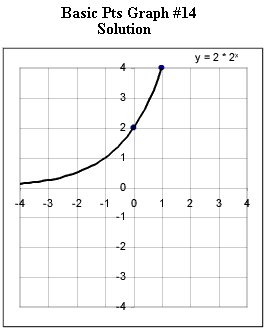
Horizontal asymptote is the x axis.
Horizontal asymptote for first graph is the line y = 1.
Horizontal asymptote for second graph is the line y = 3.
